 Permanecer
Condições de Negociações
Ferramentas


The EUR/USD currency pair failed to extend its upward move that began a few days earlier. At the beginning of the current week, markets were swept by a wave of optimism following Donald Trump's statements that the conflict in the Middle East would soon be resolved. However, by Wednesday, it became clear that there was no sign of de-escalation. Iran remains hostile and is prepared to strike any vessel attempting to pass through the Strait of Hormuz, as well as to carry out retaliatory strikes against the U.S. and its allies. Thus, while we may not have seen a new escalation, we certainly haven't seen any de-escalation either. As a result, oil prices are rising again, and the dollar is strengthening as a safe-haven currency. The macroeconomic backdrop is of minimal importance. Yesterday, the U.S. inflation report for February was released, with figures exactly matching forecasts. Thus, it was clearly not this report that triggered the dollar's strengthening.
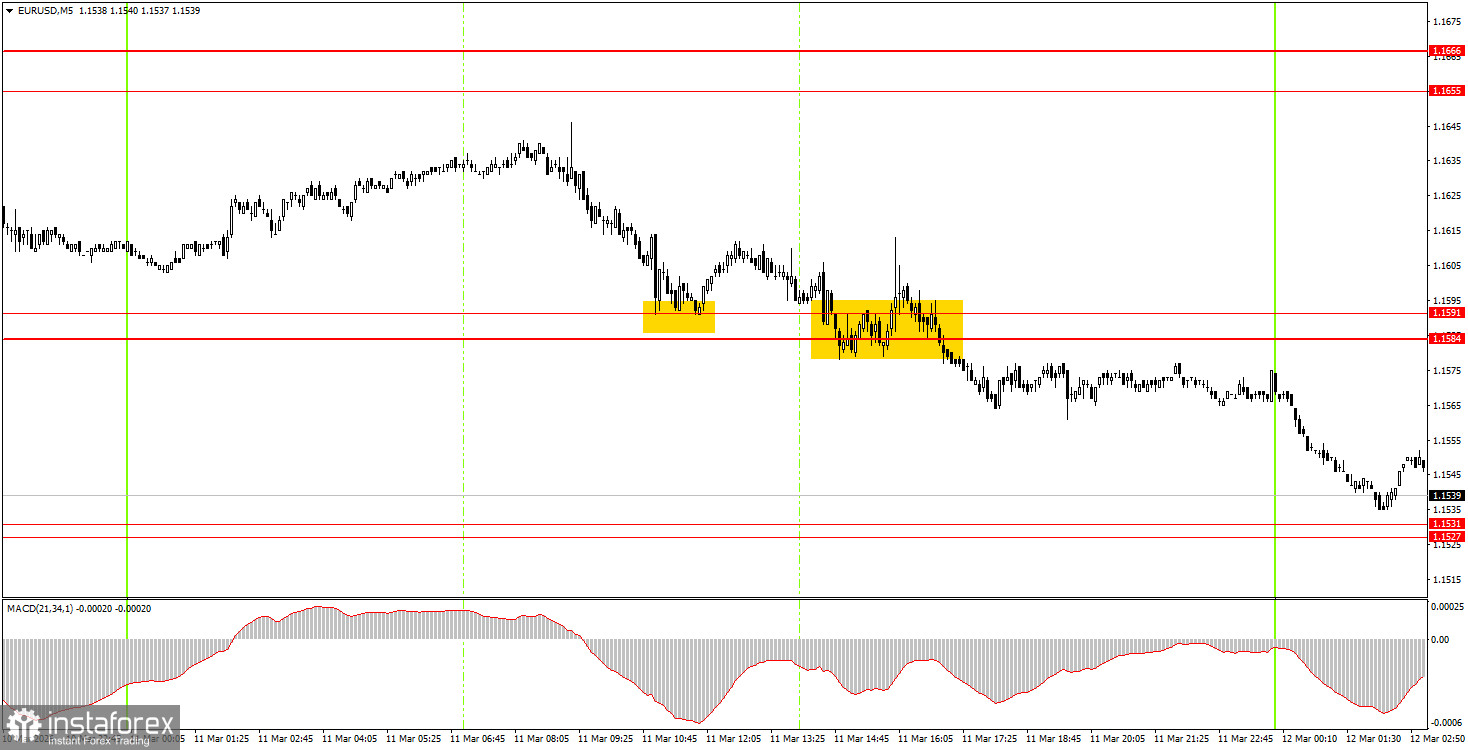
On the 5-minute timeframe, two trading signals were generated on Wednesday. During the European trading session, the price bounced off the 1.1584-1.1591 area but only rose 10 pips. Unfortunately, this signal was false. However, the next sell signal allowed novice traders to open short positions, and by Thursday morning, the pair had dropped to the area of 1.1527-1.1531. Consequently, the second trade could have yielded about 40 pips in profit.
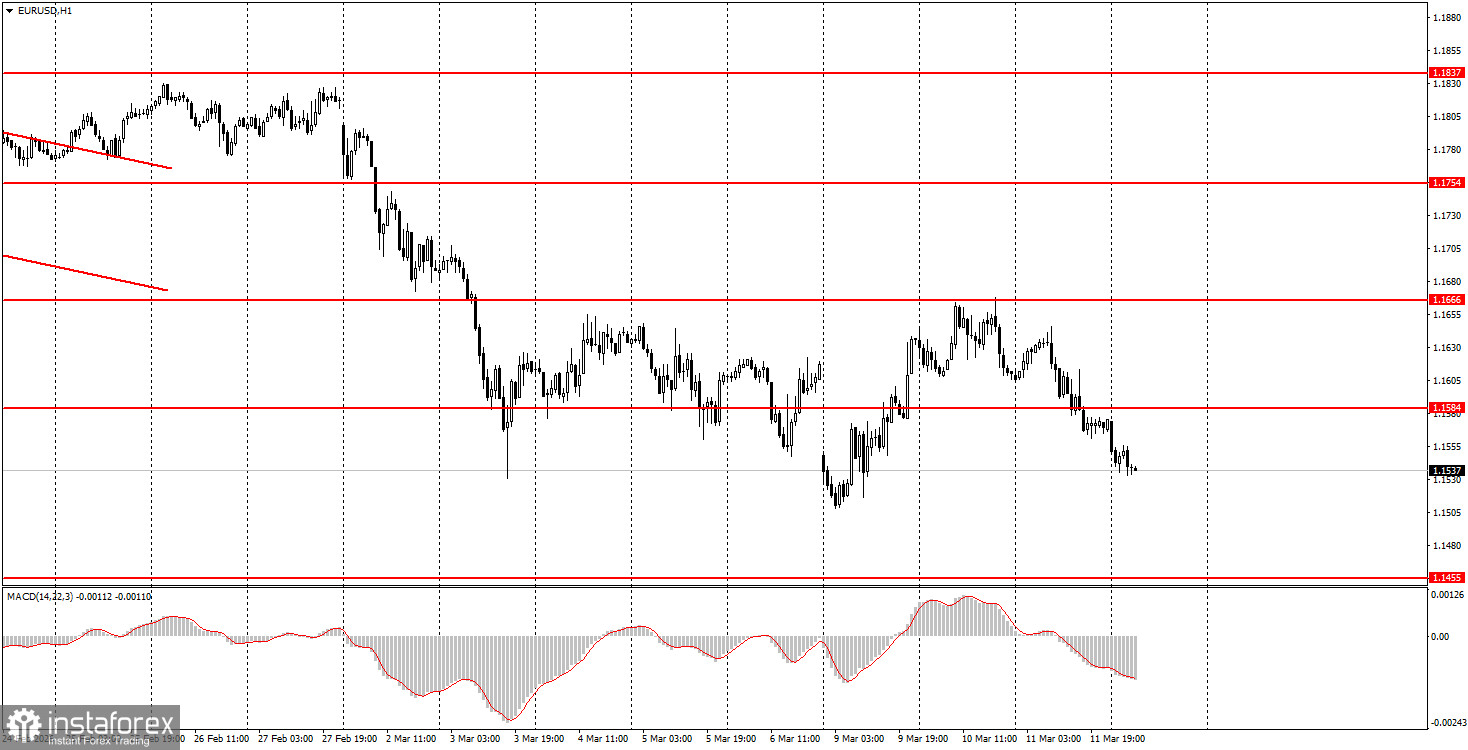
On the hourly timeframe, the downward trend continues amid renewed conflict in the Middle East. A long-term upward trend has resumed at the beginning of 2026, so we expect a new medium-term rise in the euro. The overall fundamental backdrop remains very challenging for the U.S. currency, as confirmed by the reports on the labor market, GDP, and unemployment. However, the market's key focus at this time is geopolitics, not economics.
On Thursday, beginner traders may consider short positions if the price consolidates below the 1.1527-1.1531 area, targeting 1.1455-1.1474. A price rebound from the 1.1527-1.1531 area would allow for long positions targeting 1.1584-1.1591.
On the 5-minute timeframe, the following levels should be considered: 1.1354-1.1363, 1.1413, 1.1455-1.1474, 1.1527-1.1531, 1.1584-1.1591, 1.1655-1.1666, 1.1745-1.1754, 1.1830-1.1837, 1.1899-1.1908. There are no significant events scheduled for Thursday in the U.S. or EU, only secondary reports. Thus, geopolitics will again play a dominant role today.
Price levels of support and resistance are levels that serve as targets when opening buys or sells. Take Profit levels can be placed around them.
Red lines represent channels or trend lines that show the current trend and indicate the direction in which it is preferable to trade now.
The MACD indicator (14,22,3) – the histogram and the signal line – is a supporting indicator that can also be used as a source of signals.
Important speeches and reports (always included in the news calendar) can significantly affect the movement of the currency pair. Therefore, during their release, trading should be done with utmost caution, or traders should exit the market to avoid sharp price reversals against the previous movement.
Beginning traders in the forex market should remember that not every trade can be profitable. Developing a clear strategy and effective money management are the keys to long-term trading success.
InstaForex analytical reviews will make you fully aware of market trends! Being an InstaForex client, you are provided with a large number of free services for efficient trading.


