 Permanecer
Condições de Negociações
Ferramentas


Trade analysis and tips for trading the Japanese yen
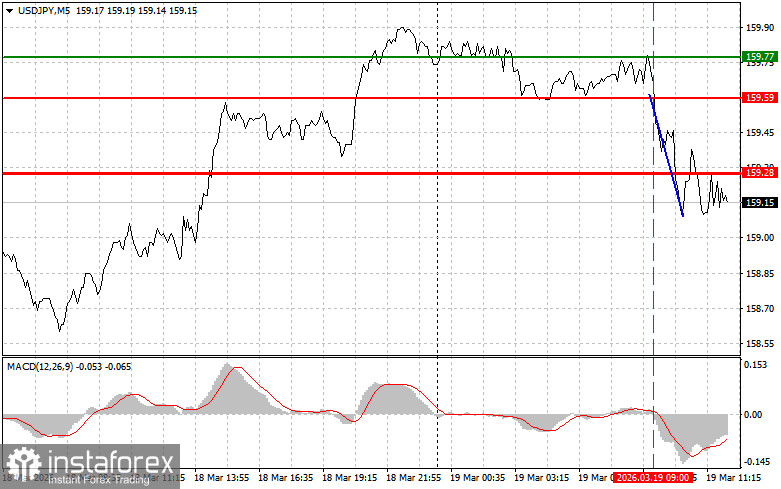
The test of the 159.59 level occurred when the MACD indicator had just begun moving downward from the zero line, confirming a correct entry point for selling the dollar. As a result, the pair dropped by more than 40 points.
Going forward, market participants will focus on US economic data, namely initial jobless claims and new home sales. An increase in jobless claims would indicate rising unemployment and a potential weakening of consumer spending, which could negatively affect the US dollar. Conversely, a decline in claims is usually interpreted as a sign of improving business activity and rising consumer confidence.
The housing sector, reflected in new home sales, is also closely linked to consumer sentiment and investment activity. Strong sales indicate demand, the availability of mortgage financing, and positive expectations for property price growth. This, in turn, stimulates the construction sector and related industries, creating a multiplier effect for the economy and supporting the dollar.
However, the strength of the price movement will depend on how much the actual figures differ from economists' forecasts.
As for the intraday strategy, I will mainly rely on the implementation of Scenarios No. 1 and No. 2.
Buy Signal
Scenario No. 1: I plan to buy USD/JPY today when the price reaches the entry point around 159.30 (green line on the chart), with a target of 159.75 (thicker green line on the chart). Around 159.75, I will exit long positions and open short positions in the opposite direction (expecting a 30–35 point move). Growth in the pair can be expected today after strong data. Important! Before buying, make sure the MACD indicator is above the zero line and just beginning to rise from it.
Scenario No. 2: I also plan to buy USD/JPY today if there are two consecutive tests of the 159.09 level while the MACD indicator is in the oversold area. This will limit the pair's downward potential and lead to an upward reversal. Growth toward the opposite levels of 159.30 and 159.75 can be expected.
Sell Signal
Scenario No. 1: I plan to sell USD/JPY today after a break of the 159.09 level (red line on the chart), which will lead to a rapid decline in the pair. The key target for sellers will be 158.74, where I will exit short positions and immediately open long positions in the opposite direction (expecting a 20–25 point move). Pressure on the pair will return today in the event of very weak data.Important! Before selling, make sure the MACD indicator is below the zero line and just beginning to decline from it.
Scenario No. 2: I also plan to sell USD/JPY today if there are two consecutive tests of the 159.30 level while the MACD indicator is in the overbought area. This will limit the pair's upward potential and lead to a downward reversal. A decline toward the opposite levels of 159.09 and 158.74 can be expected.
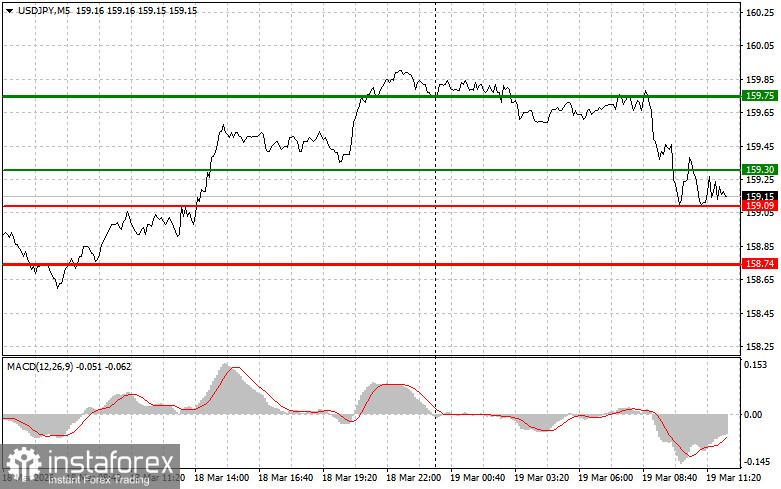
What's on the chart:
Important
Beginner Forex traders should make entry decisions very carefully. Before major fundamental reports are released, it is best to stay out of the market to avoid sharp price fluctuations. If you decide to trade during news releases, always use stop-loss orders to minimize losses. Without stop-loss orders, you can quickly lose your entire deposit, especially if you do not use proper money management and trade large volumes.
Remember, successful trading requires a clear trading plan like the one outlined above. Spontaneous trading decisions based on current market conditions are generally a losing strategy for intraday traders.
InstaForex analytical reviews will make you fully aware of market trends! Being an InstaForex client, you are provided with a large number of free services for efficient trading.


