 Permanecer
Condições de Negociações
Ferramentas


The GBP/USD pair also showed strong growth on Monday, which traders could easily capitalize on by trading based on technical factors. But let's take it step by step. Last week, we noted that the market had no particular reasons to sell the dollar, as the ceasefire in the Middle East was quite fragile, and negotiations in Islamabad ended in failure. However, the market seemed to begin moving away from trading solely on geopolitics. As the new week began, this hypothesis started to be confirmed. Despite Donald Trump's decision to block the Strait of Hormuz for Iranian tankers (which will create an even greater oil shortage worldwide), the US dollar continues to decline. Thus, we believe the market has freed itself from the shackles of geopolitics and is now ready to recall all events and news from the last two months that were ignored because they did not touch on geopolitical issues. Consequently, the dollar has been falling for over a week and may continue to decline.
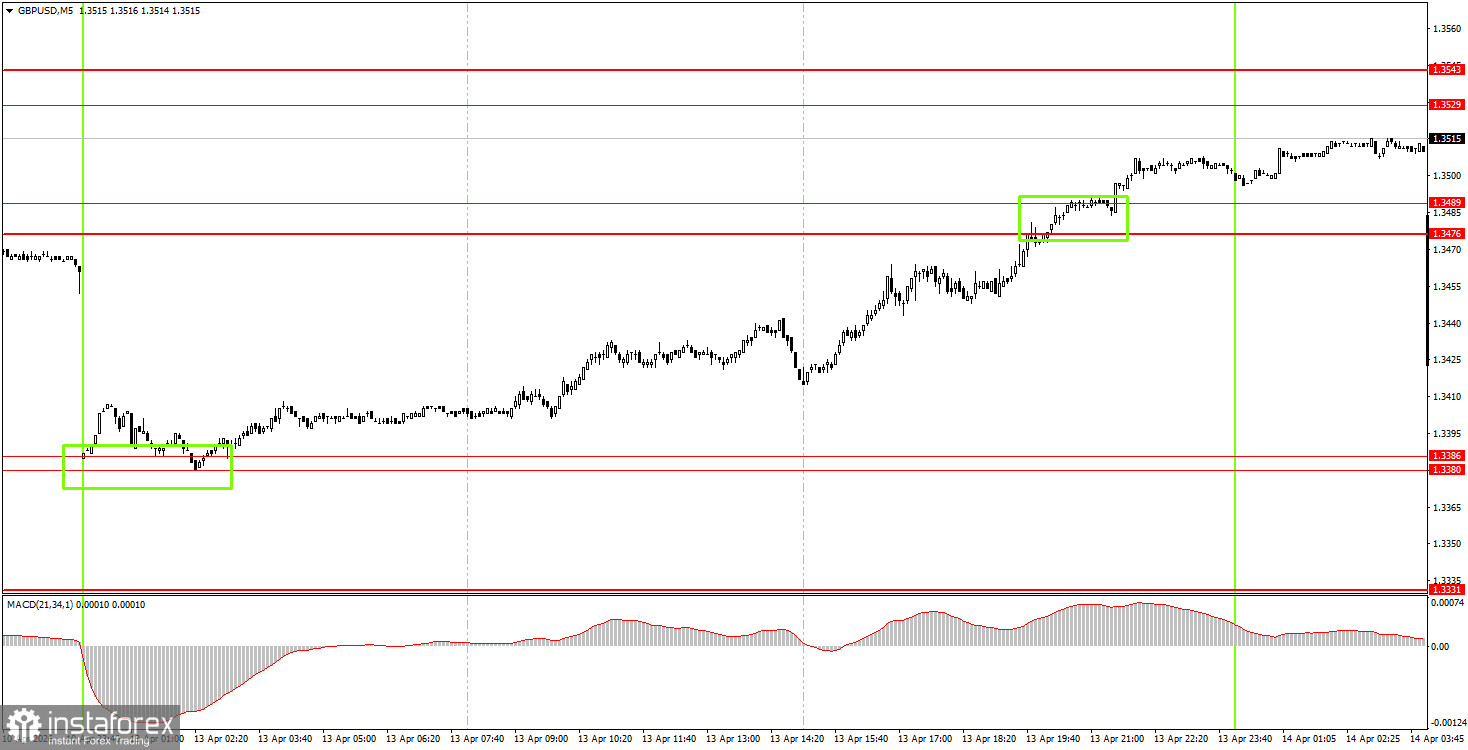
On the 5-minute timeframe, two trading signals were formed for the British currency on Monday. First, the pair bounced off the area of 1.3380-1.3386, remained in an upward movement throughout the day, and by the end of the day broke through the area of 1.3476-1.3489. Thus, novice traders had at least two opportunities to open long positions, and today the pair's growth may well continue.
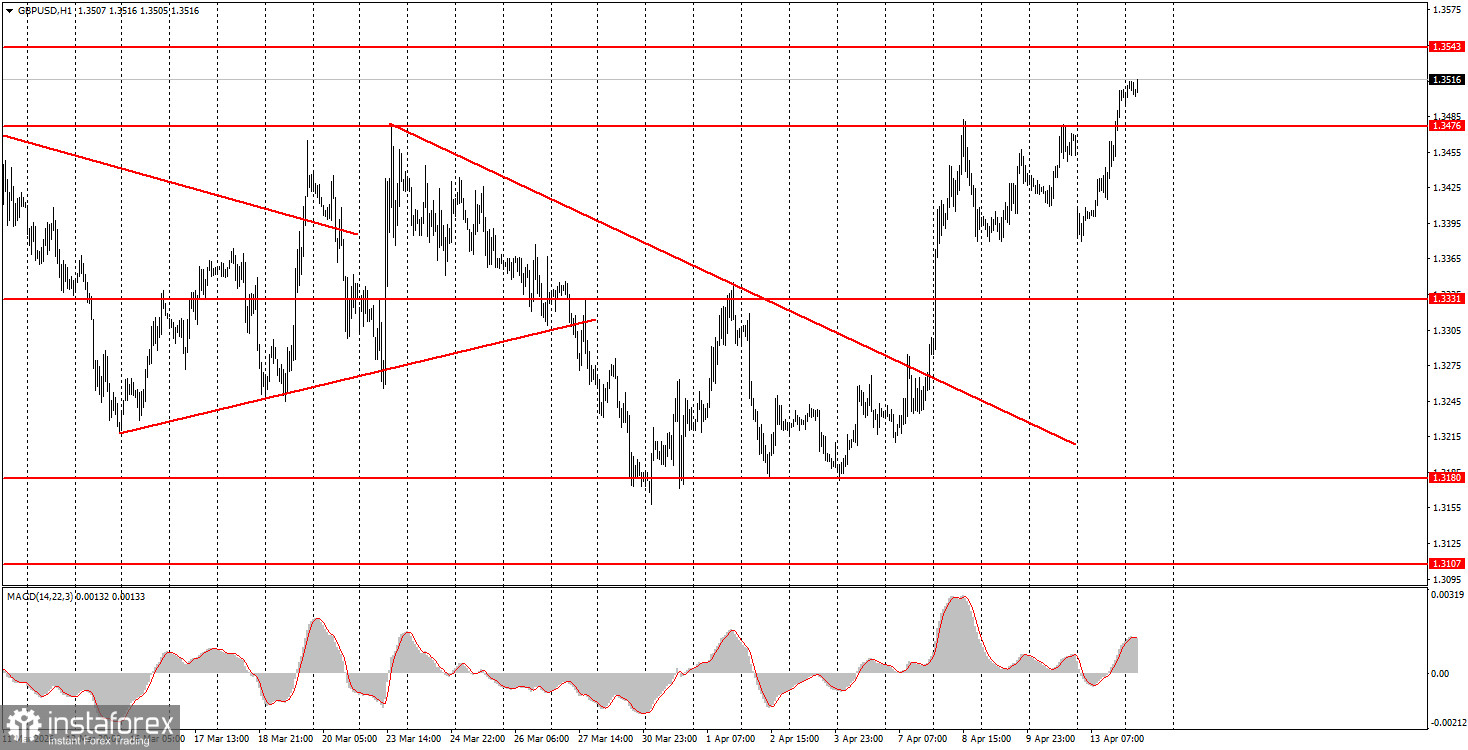
On the hourly timeframe, the GBP/USD pair continues to form a new upward trend. There are no global reasons for medium-term dollar growth, so we expect the global upward trend that began in 2025 to resume in 2026. For this to happen, geopolitical tensions worldwide need to continue to ease; however, there is another scenario in which the market simply ignores geopolitics after two months of trading based solely on this factor.
On Tuesday, novice traders may open short positions if the price consolidates below the 1.3476-1.3489 area, targeting 1.3380-1.3386. A consolidation above the area of 1.3476-1.3489 allows traders to maintain long positions with targets at 1.3529-1.3543 and 1.3643-1.3652.
On the 5-minute timeframe, trading can currently be conducted at levels 1.3096-1.3107, 1.3175-1.3180, 1.3259-1.3267, 1.3319-1.3331, 1.3380-1.3386, 1.3476-1.3489, 1.3529-1.3543, 1.3643-1.3652, 1.3695, and 1.3741-1.3751. Today, there are again no significant events planned in the UK, while the US will release two secondary reports: ADP and PPI. We consider the weekly ADP report and the Producer Price Index to be entirely secondary indicators and do not expect a market reaction to them.
Price levels of support and resistance are levels that serve as targets when opening buys or sells. Take Profit levels can be placed around them.
Red lines represent channels or trend lines that show the current trend and indicate the direction in which it is preferable to trade now.
The MACD indicator (14,22,3) – the histogram and the signal line – is a supporting indicator that can also be used as a source of signals.
Important speeches and reports (always included in the news calendar) can significantly affect the movement of the currency pair. Therefore, during their release, trading should be done with utmost caution, or traders should exit the market to avoid sharp price reversals against the previous movement.
Beginning traders in the forex market should remember that not every trade can be profitable. Developing a clear strategy and effective money management are the keys to long-term trading success.
InstaForex analytical reviews will make you fully aware of market trends! Being an InstaForex client, you are provided with a large number of free services for efficient trading.


