 Permanecer
Condições de Negociações
Ferramentas


The GBP/USD pair traded quite calmly on Monday, despite the geopolitical backdrop that could have sparked a storm. Markets had been waiting all week for a new round of negotiations between the US and Iran, but none took place on Saturday, Sunday, or Monday. Essentially, this is another diplomatic failure, although we continue to view the possibility of a ceasefire between Tehran and Washington with great skepticism. Both sides of the conflict continue to present each other with lists of ultimatums but show no willingness to compromise on key disagreements. Therefore, we do not believe that the war in the Middle East will end anytime soon. Most likely, it will transition into a protracted conflict, and the Strait of Hormuz will remain blocked for a long time, even if it is not in Iran's best interest. Nonetheless, we did not see any growth in the dollar on Monday, but this does not mean that it cannot start later in the week. The geopolitical factor is diminishing its influence on the currency market, but it can still tip the scales in favor of bears.
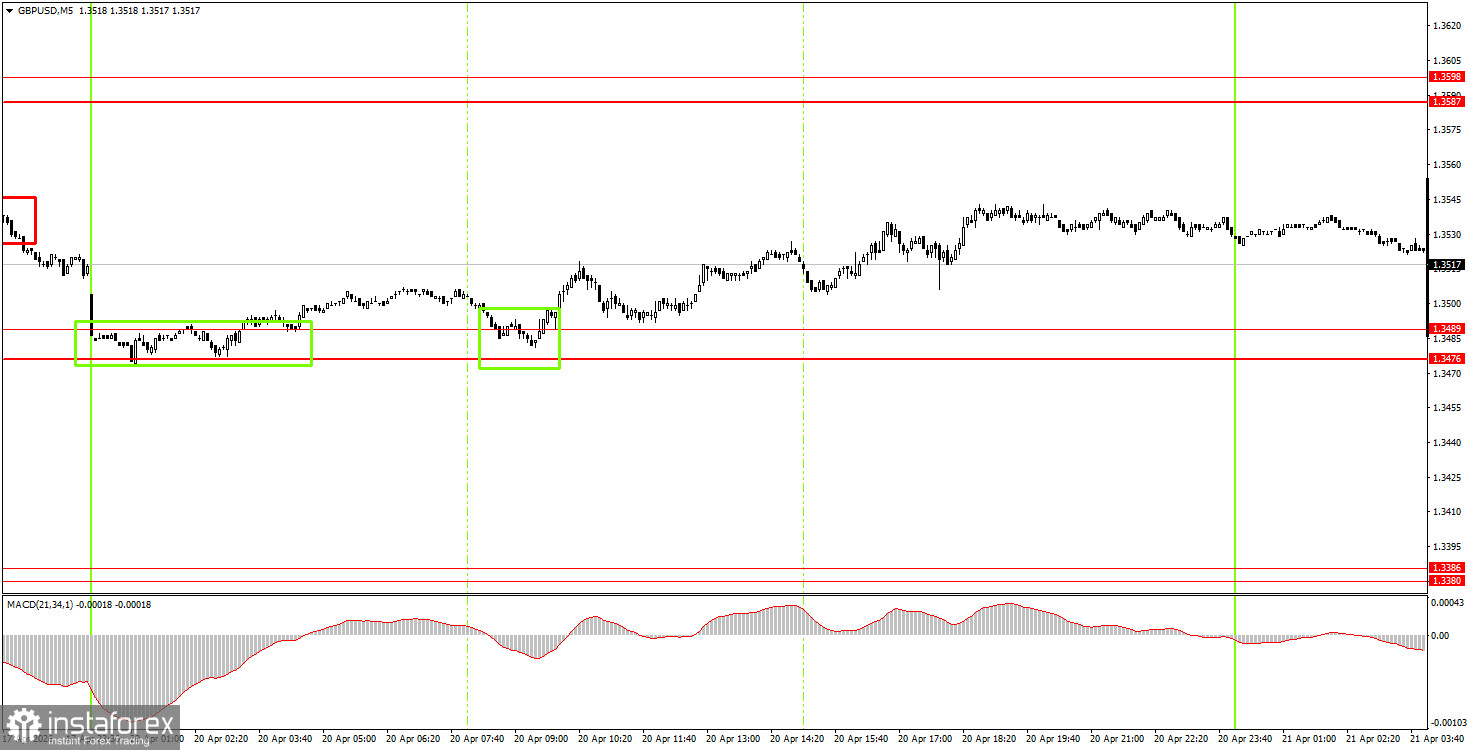
On the 5-minute timeframe, one trading signal was formed on Monday, which beginner traders could have easily acted upon. During the European trading session, the price bounced off the area of 1.3476-1.3489, prompting a 30-pip rise throughout the day. These 30 pips were easily attainable for beginners.
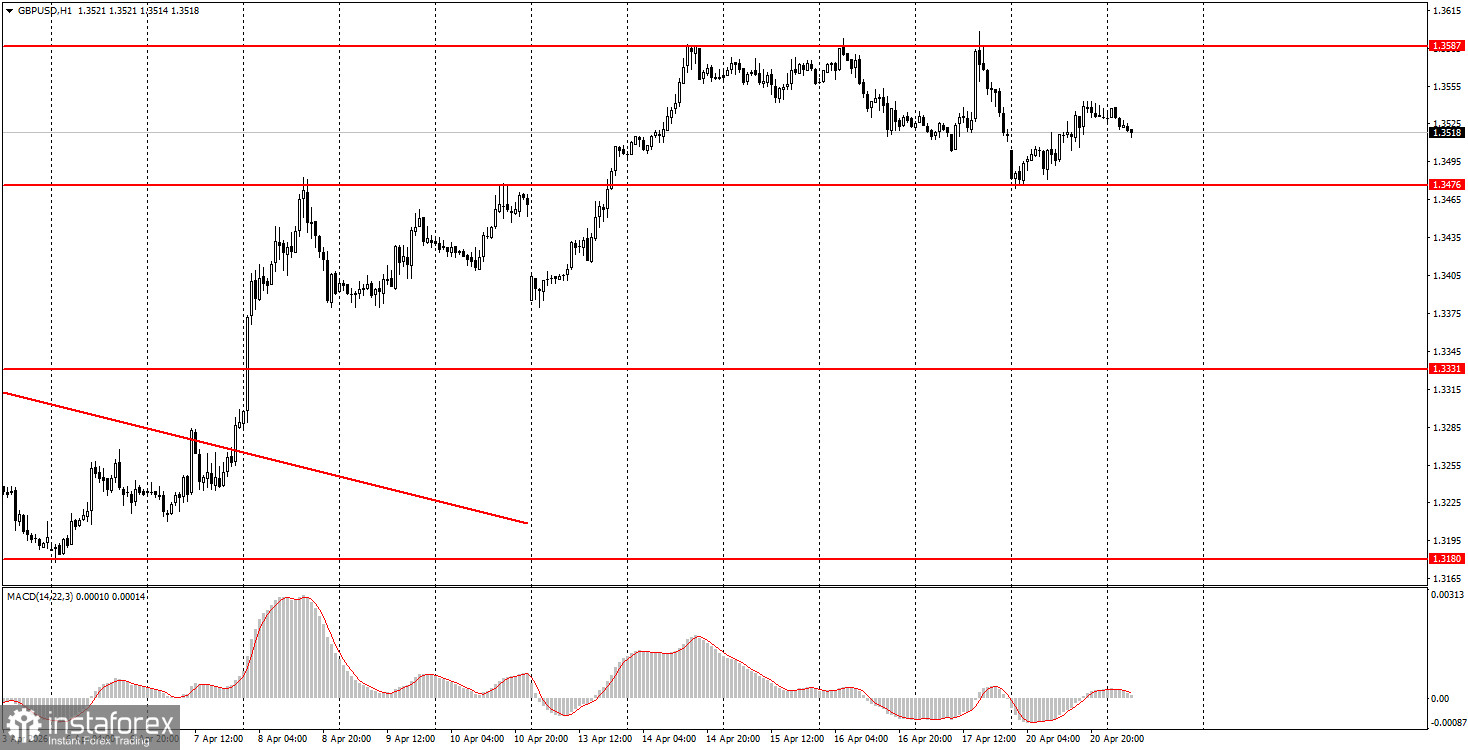
On the hourly timeframe, the GBP/USD pair continues to form an upward trend. There are no global grounds for medium-term dollar growth, so we expect a resumption of the global upward trend of 2025 in 2026. For this to happen, global geopolitical tensions need to continue to decline. In any case, we believe that without a serious escalation in the Middle East, the dollar will no longer be able to sustain the growth it has shown over the past two months. However, individual events can still provoke their strengthening.
On Tuesday, beginner traders may consider opening short positions if the price settles below the 1.3476-1.3489 area, targeting 1.3380-1.3386. A price bounce from the area of 1.3476-1.3489 will allow for new long positions to be opened, targeting 1.3587-1.3598.
On the 5-minute timeframe, trading can currently take place at levels 1.3175-1.3180, 1.3259-1.3267, 1.3319-1.3331, 1.3380-1.3386, 1.3476-1.3489, 1.3587-1.3598, 1.3695, and 1.3741-1.3751. Today, reports on unemployment, wages, and jobless claims will be published in the UK. While these are not the most critical reports, some reaction may follow. In the US, only secondary reports are expected.
Price levels of support and resistance are levels that serve as targets when opening buys or sells. Take Profit levels can be placed around them.
Red lines represent channels or trend lines that show the current trend and indicate the direction in which it is preferable to trade now.
The MACD indicator (14,22,3) – the histogram and the signal line – is a supporting indicator that can also be used as a source of signals.
Important speeches and reports (always included in the news calendar) can significantly affect the movement of the currency pair. Therefore, during their release, trading should be done with utmost caution, or traders should exit the market to avoid sharp price reversals against the previous movement.
Beginning traders in the forex market should remember that not every trade can be profitable. Developing a clear strategy and effective money management are the keys to long-term trading success.
InstaForex analytical reviews will make you fully aware of market trends! Being an InstaForex client, you are provided with a large number of free services for efficient trading.


