 Permanecer
Condições de Negociações
Ferramentas


The EUR/USD currency pair continued its weak downward corrective movement on Thursday. Throughout the previous day, business activity indices for the services and manufacturing sectors were published in the US and the Eurozone, but the market barely noticed. There was no reaction to either block of reports, and the day's overall volatility was 47 pips. The entire current week is proving to be corrective, as we warned over the weekend. Meanwhile, Donald Trump continues to comment daily on the situation with Iran; however, the market has long ceased to pay attention to his speeches. It is now focused solely on the facts. The facts right now are as follows: the Strait of Hormuz is closed, there are no negotiations, military actions are not being conducted, but war could resume at any moment. Since there are currently no negotiations between Tehran and Washington, the market leans toward the belief that war will resume in one form or another. However, the dollar is rising not because of this, but for technical reasons.
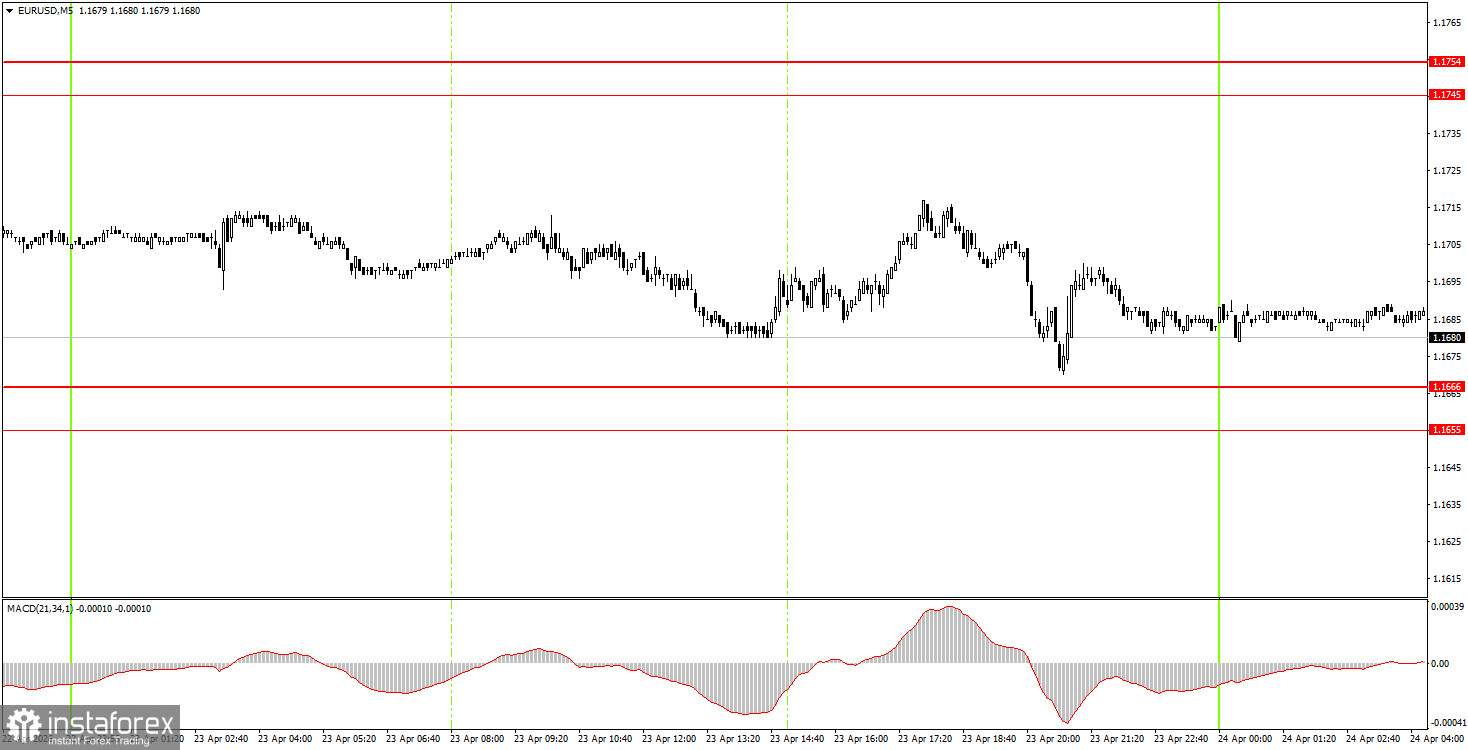
On the 5-minute timeframe, no trading signals were formed on Thursday. Only during the American trading session did the price approach the 1.1655-1.1666 area, but it fell short by 6 pips. This margin is quite significant. Therefore, there were no grounds for beginners to open trades.
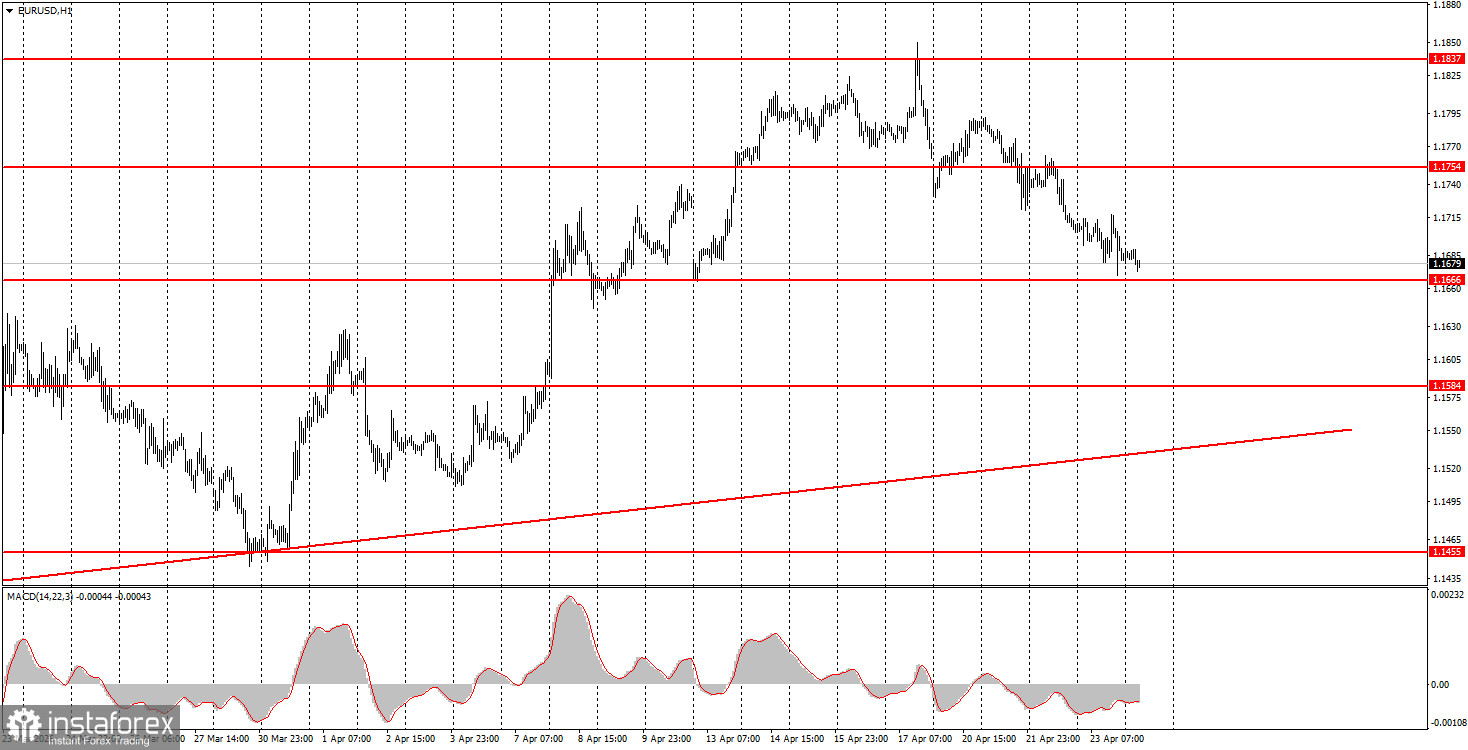
On the hourly timeframe, the upward trend remains intact. For two consecutive weeks, the market has sold off the dollar, and geopolitics has receded somewhat into the background. However, the geopolitical situation is worsening again, and the U.S. dollar may be in demand again as a safe asset. We consider the reason to be technical, but in any case, traders have technical levels to trade, and movements will depend on developments in the Middle East.
On Friday, novice traders can open short positions if the price consolidates below the 1.1655-1.1666 area, targeting 1.1584-1.1591. New long positions can be considered on a bounce from the 1.1655-1.1666 area, targeting 1.1745-1.1754.
On the 5-minute timeframe, levels to consider include 1.1354-1.1363, 1.1413, 1.1455-1.1474, 1.1527-1.1531, 1.1584-1.1591, 1.1655-1.1666, 1.1745-1.1754, 1.1830-1.1837, and 1.1899-1.1908. On Friday, Germany will publish the business climate index, and the University of Michigan will release the consumer sentiment index in the US. We believe this data will be ignored, just as all previous reports over the last two months have been.
Price levels of support and resistance are levels that serve as targets when opening buys or sells. Take Profit levels can be placed around them.
Red lines represent channels or trend lines that show the current trend and indicate the direction in which it is preferable to trade now.
The MACD indicator (14,22,3) – the histogram and the signal line – is a supporting indicator that can also be used as a source of signals.
Important speeches and reports (always included in the news calendar) can significantly affect the movement of the currency pair. Therefore, during their release, trading should be done with utmost caution, or traders should exit the market to avoid sharp price reversals against the previous movement.
Beginning traders in the forex market should remember that not every trade can be profitable. Developing a clear strategy and effective money management are the keys to long-term trading success.
InstaForex analytical reviews will make you fully aware of market trends! Being an InstaForex client, you are provided with a large number of free services for efficient trading.


