 Permanecer
Condições de Negociações
Ferramentas


The EUR/USD pair on Monday continued trading above the 50.0% Fibonacci corrective level at 1.1745, constantly changing direction. Under the current conditions, traders can only trade from the 1.1745 level. Another rebound from this level would allow expectations for renewed growth toward the 61.8% corrective level at 1.1824. A consolidation below 1.1745 would favor the US dollar and lead to some decline toward the 38.2% Fibonacci level at 1.1666.
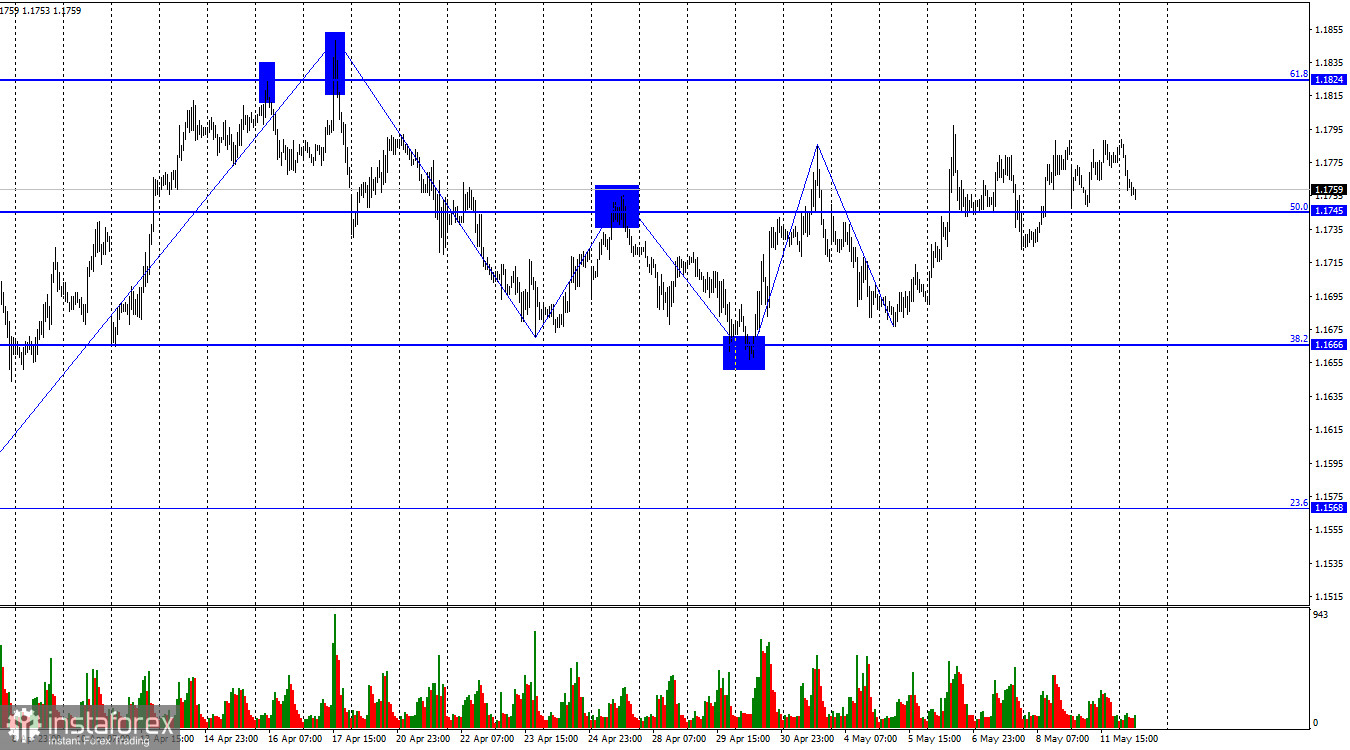
The wave structure on the hourly chart currently remains straightforward. The latest completed downward wave did not break the previous low, while the new upward wave broke above the last peak. Thus, the trend remains bullish, though highly unstable — all recent waves are approximately equal in size. The temporary ceasefire between Iran and the United States supported the bulls, but now, three weeks later, it can be said that geopolitical developments are moving toward preserving the conflict. Therefore, bullish attacks may remain limited or stop altogether.
Monday's news background was interesting, but traders once again reacted very inconsistently to the events and headlines. To understand the unusual market behavior, we should begin with Friday, when important US Nonfarm Payrolls and unemployment data were released but received virtually no reaction from traders. Interestingly, bears had an excellent opportunity to launch an attack that day, but instead chose to wait for the weekend.
Over the weekend, another escalation attempt occurred around the Strait of Hormuz. Several American ships attacked Iranian ports and received retaliation. On Monday, Donald Trump stated that he had received a counterproposal from Iran regarding ending the conflict and reaching an agreement, but he found it completely unacceptable. As a result, Iran rejected the US proposal, while the United States rejected Iran's proposal. The central issue remains the "nuclear clause," where the sides have not come close to reaching consensus. As before, Iran is willing to temporarily freeze uranium enrichment and accept international oversight of nuclear facilities, but not to fully abandon nuclear energy or transfer all uranium reserves to third countries. Meanwhile, Washington insists precisely on those conditions. How the sides intend to reach an agreement remains unclear to me.
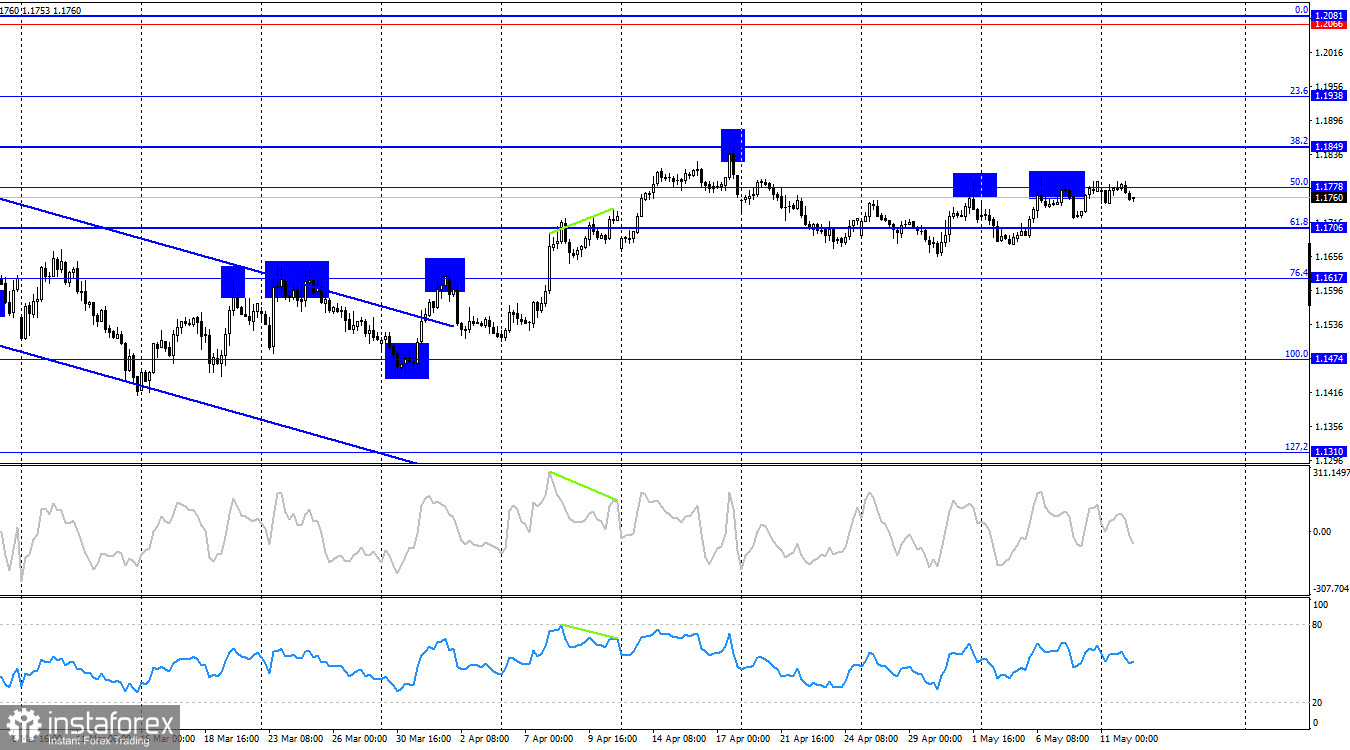
On the 4-hour chart, the pair reversed in favor of the US dollar and began declining toward the 76.4% corrective level at 1.1617. A rebound from the 1.1778 level would once again allow expectations for some decline. In my view, the hourly chart is currently more informative due to weak market movements. Bulls seized the initiative about a month ago, but are now searching for new growth drivers. No emerging divergences are visible today on any indicator.
Commitments of Traders (COT) Report:
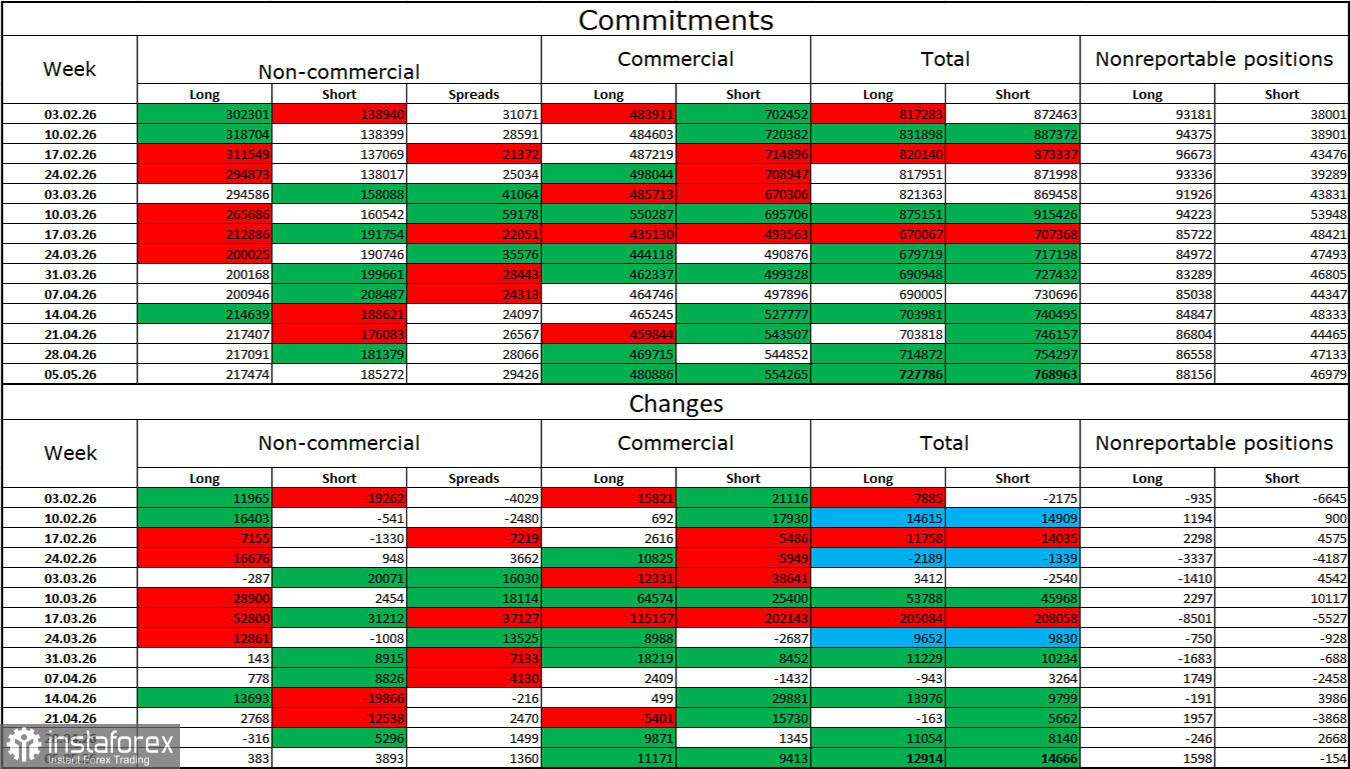
During the latest reporting week, professional traders opened 383 long positions and 3,893 short positions. Over seven weeks in February and March, the bulls' overwhelming advantage disappeared, while over the last six weeks the situation has somewhat stabilized. The total number of long positions held by speculators now stands at 217,000, compared to 185,000 short positions. The gap is once again widening in favor of the euro.
Overall, in the long term, major market participants continue to view the euro with considerable interest. Naturally, various global events — which have been plentiful in recent years — continue to influence investor sentiment. In particular, market attention remains focused on the Middle East, where the war has merely been paused rather than ended. Therefore, in the near future, movements in the euro and dollar will depend not on Federal Reserve or ECB monetary policy or economic data, but on developments in Iran.
US and Eurozone Economic Calendar:
The May 12 economic calendar contains three events, one of which is especially important. The news backdrop will influence market sentiment on Tuesday, particularly during the second half of the day.
EUR/USD Forecast and Trading Tips:
Selling opportunities are possible today if the pair consolidates below the 1.1745 level on the hourly chart, targeting 1.1666. New buying positions may be considered after a rebound from the 1.1745 level, targeting 1.1824.
Fibonacci retracement grids are based on 1.2082–1.1410 on the hourly chart and on 1.1474–1.2082 on the 4-hour chart.
InstaForex analytical reviews will make you fully aware of market trends! Being an InstaForex client, you are provided with a large number of free services for efficient trading.


