 Permanecer
Condições de Negociações
Ferramentas


The GBP/USD pair plummeted by 130 pips on Thursday, driven by a combination of negative factors this week. The key factor was, of course, geopolitics, as Iran and the US have begun to drift away from a peaceful agreement and nuclear deal, and the temporary ceasefire could end at any moment. However, the political crisis in the UK and high inflation in the US also played a role. It can be said that in the first three days of the week, the market was still holding back from a mass sell-off of the pair, but on Thursday, nerves gave way. Therefore, without any visible reason, the British pound fell sharply. On the other hand, the data on industrial production and GDP for the first quarter that were published in the UK yesterday were not bad at all. At the very least, the figures were no worse than the forecasts. Thus, it is definitely not the British data that triggered the collapse. The same situation applies to the American data. The inflation report increased the likelihood of at least one tightening of monetary policy in 2026, but it is not the primary reason for the pair's decline.
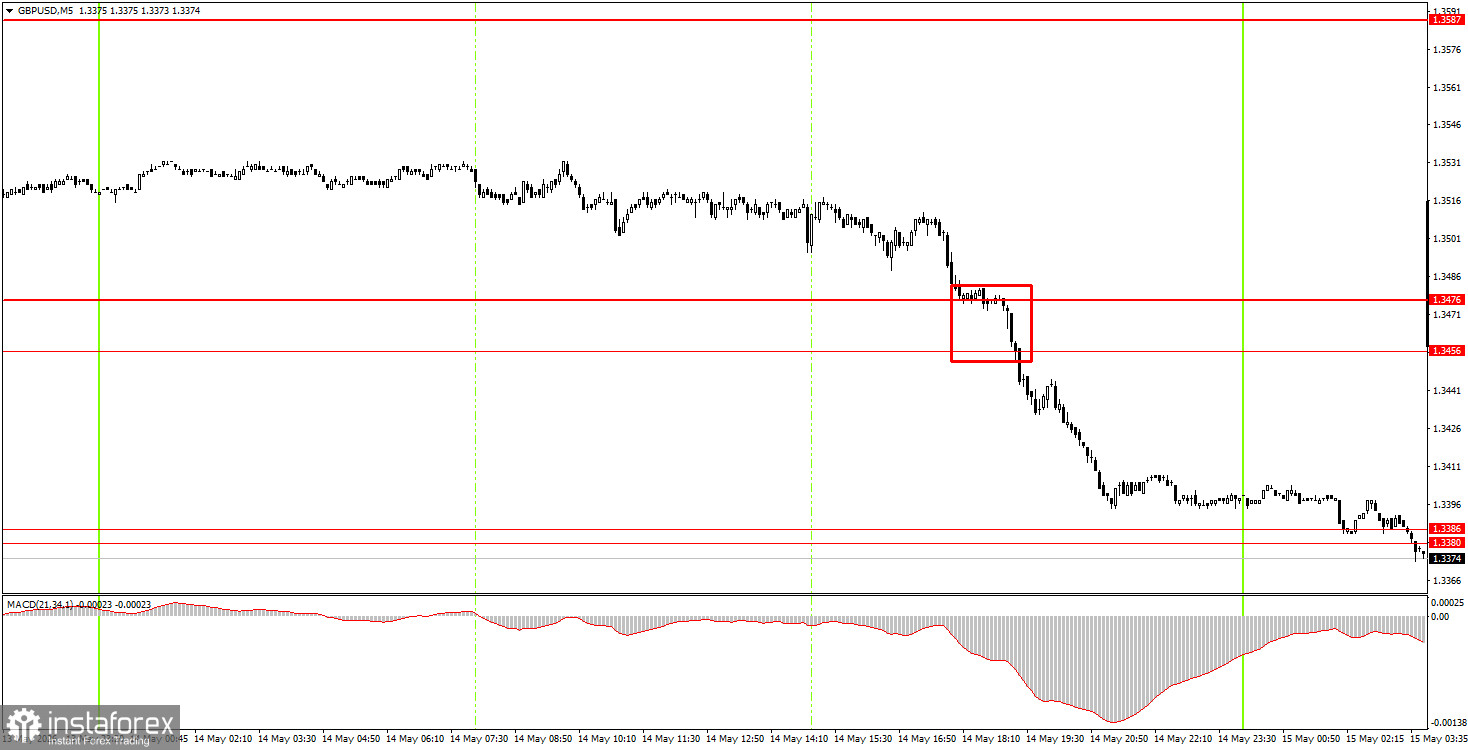
On the 5-minute timeframe, there was exactly one trading signal formed on Thursday. During the American trading session, the pair consolidated below the 1.3456-1.3476 range, allowing traders to open short positions. By Friday morning, the nearest target area, 1.3380-1.3386, was reached, and traders could have made about 60 pips of profit on this trade.
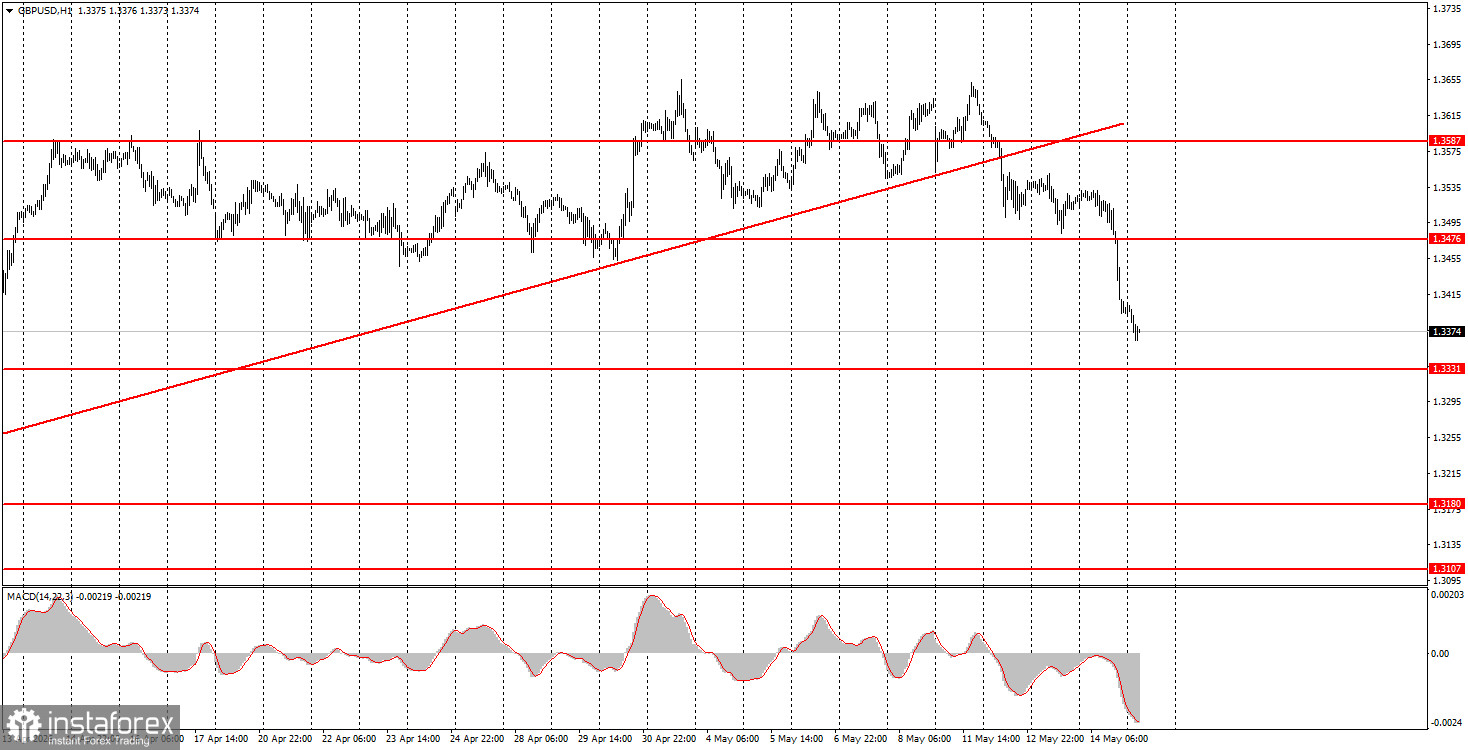
On the hourly timeframe, the GBP/USD pair is starting a downward trend due to geopolitical pressure. Without a significant escalation in the Middle East, the dollar cannot expect to grow as it did in February and March. Nevertheless, individual events can still trigger their strengthening, which we have been observing in recent days. The British currency retains excellent upward potential, according to trends on the daily and weekly timeframes.
On Friday, novice traders can open short positions targeting 1.3319-1.3331, as the pair has consolidated below the 1.3380-1.3386 range. A consolidation above the 1.3380-1.3386 area will allow for long positions with a target of 1.3456-1.3476.
On the 5-minute timeframe, trading can currently be done at the following levels: 1.3175-1.3180, 1.3259-1.3267, 1.3319-1.3331, 1.3380-1.3386, 1.3456-1.3476, 1.3587-1.3598, 1.3631-1.3641, 1.3695, 1.3741-1.3751. Today, no significant events are scheduled in the UK, while in the US, only a report on industrial production will be released. Thus, today, technical analysis and geopolitics will prevail.
Price levels (areas) of support and resistance – levels that are targets when opening purchases or sales, or sources of signals.
Red lines – channels or trend lines that display the current trend and indicate which direction is preferable to trade now.
MACD indicator (14, 22, 3) – histogram and signal line – a supporting indicator that can also be used as a source of signals.
Important speeches and reports (contained in the news calendar) can significantly influence the movement of the currency pair. Therefore, during their release, trading should be done as cautiously as possible, or one should exit the market to avoid a sharp price reversal against the preceding movement.
Beginners trading in the Forex market should remember that not every trade can be profitable. Developing a clear strategy and sound money management are key to long-term trading success.
InstaForex analytical reviews will make you fully aware of market trends! Being an InstaForex client, you are provided with a large number of free services for efficient trading.


