 Permanecer
Condições de Negociações
Ferramentas


AUD/USD has recently broken out of a multi year consolidation triangle pattern and is in a weekly bullish trend heading for 0.87. Short-term trend is bullish but over the next few weeks, we might see a deeper pull back which will be a huge buying opportunity.
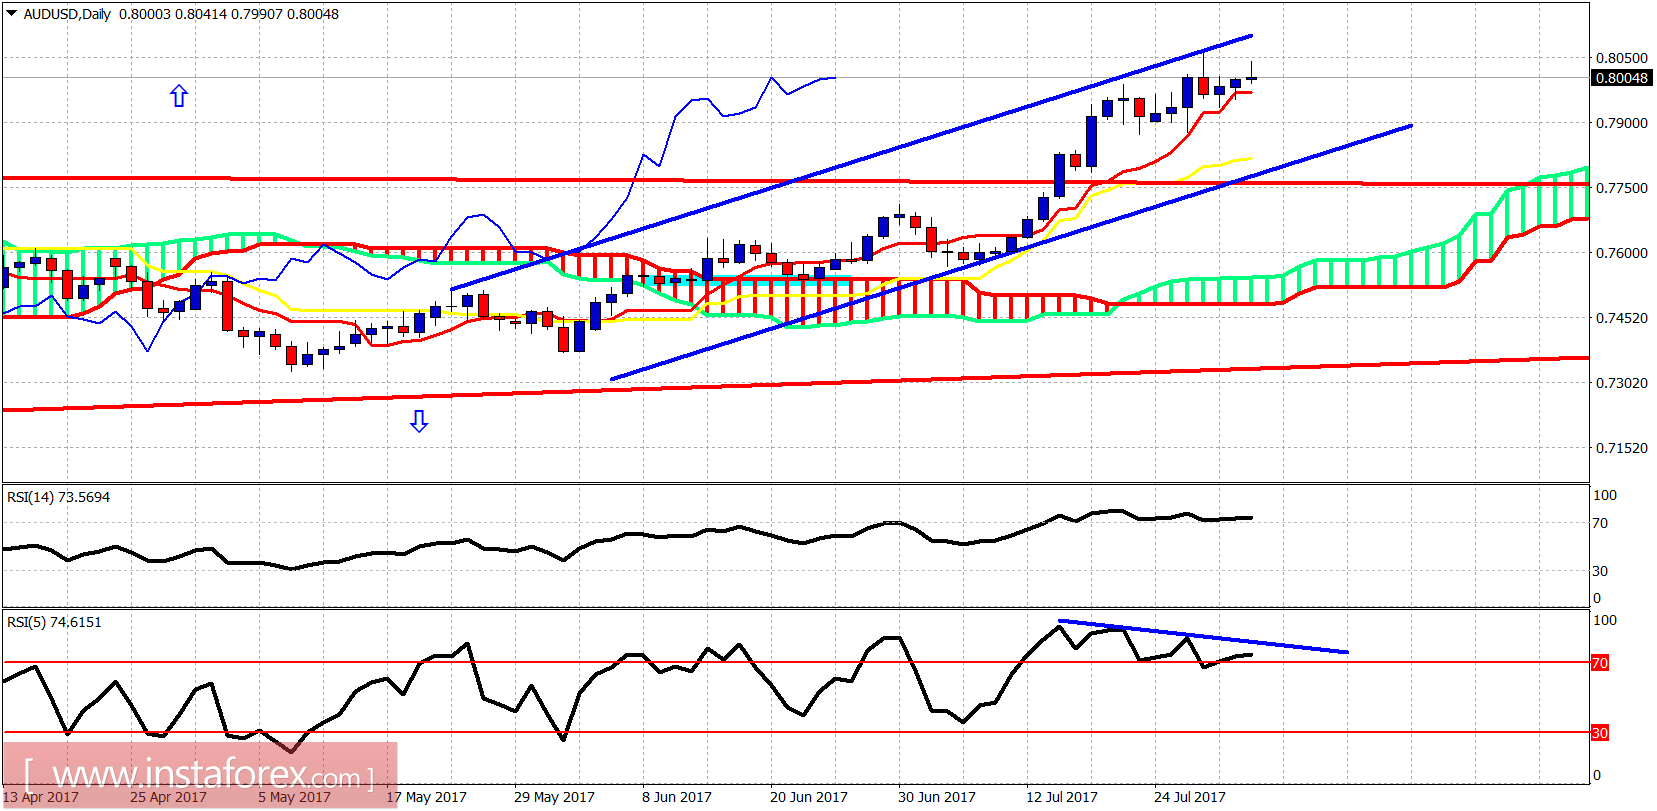
The AUD/USD is trading inside the bullish channel making higher highs and higher lows. The RSI (5) is diverging but still, the price is in a daily bullish trend. I could justify a pull back towards the lower channel boundary in order for the oscillators to relieve the overbought conditions. However, in general, I would expect a back test of the broken triangle pattern around 0.77-0.78 and then resumption of the up trend.
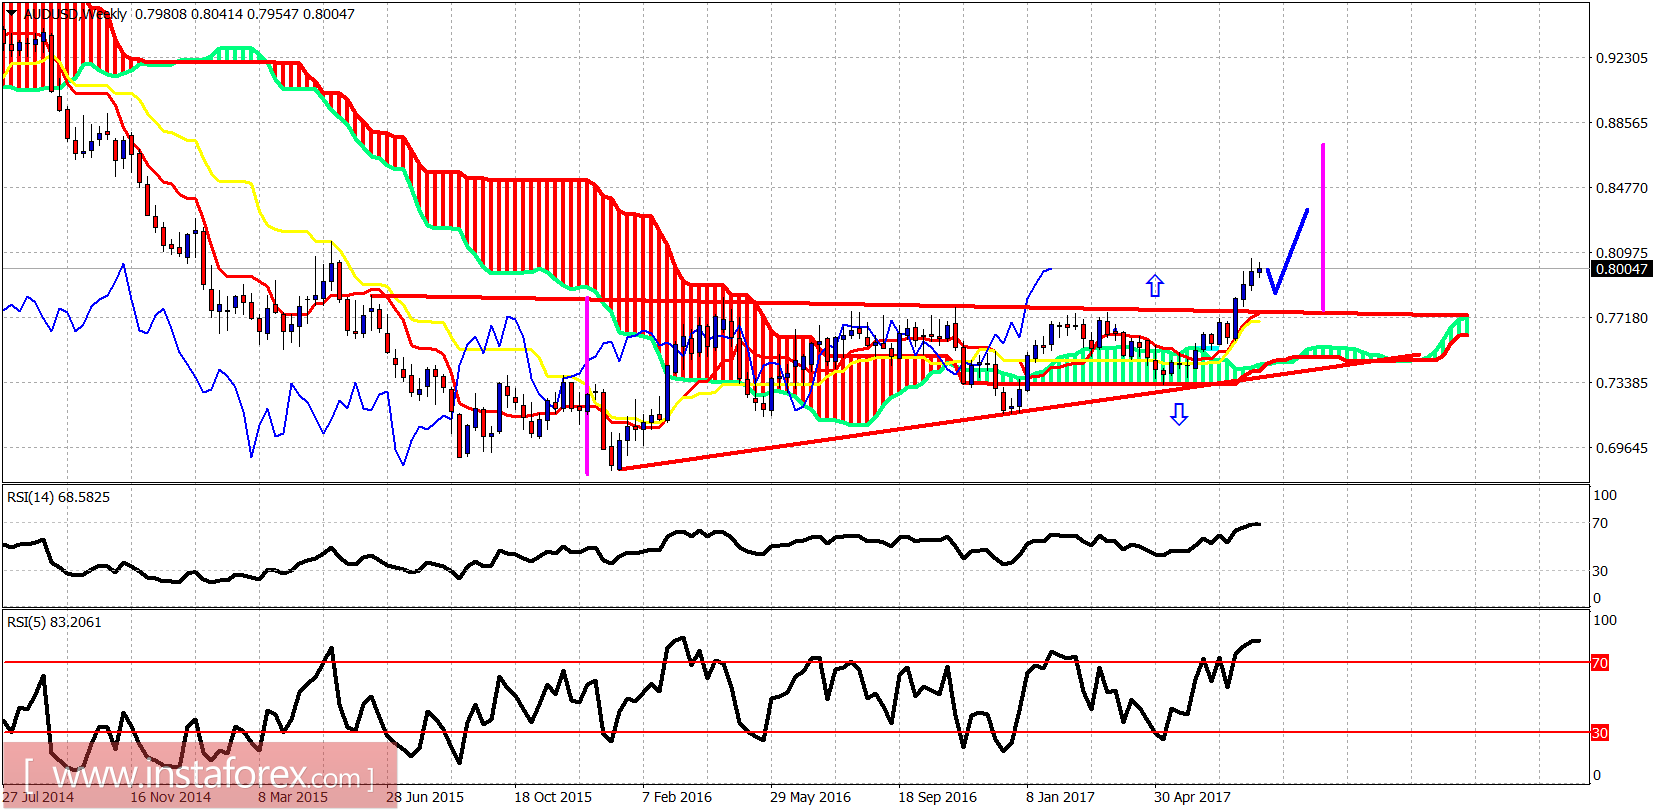
Red lines - triangle pattern
Magenda lines - target of triangle breakout
The AUD/USD is in a breakout mode heading towards 0.87. The trend is bullish in the weekly chart as the price is above the Kumo (cloud) and tenkan- sen has crossed the kijun-sen above the cloud. The length of the triangle base is now the target of the expected move of the breakout.
InstaForex analytical reviews will make you fully aware of market trends! Being an InstaForex client, you are provided with a large number of free services for efficient trading.


