empty
 
 
Ön épp elhagyja a weblapot
www.instaforex.eu >
a weblap üzemeltetője a(z)
INSTANT TRADING EU LTD
Számlanyitás

18.11.202009:26 Forex-elemzések és áttekintések: Indicator analysis. Daily review on the GBP/USD currency pair for November 18, 2020

Ezeket az információkat marketingkommunikációnk részeként küldjük el lakossági és professzionális ügyfeleink számára. Nem tartalmaznak és nem tekintendők befektetési tanácsnak vagy javaslatnak, sem bármilyen pénzügyi instrumentummal való tranzakcióra vagy kereskedési stratégia használatára irányuló ajánlatnak vagy felkérésnek. A korábbi teljesítmény nem garantálja vagy jósolja meg a jövőbenit. Az Instant Trading EU Ltd. nem képviseli vagy garantálja a szolgáltatott információk pontosságát vagy teljességét, illetve nem felelős bármely, az elemzéseken, előrejelzéseken vagy a Vállalat munkatársa által adott információkon alapuló befektetések esetleges veszteségéért. A teljes felelősségkizárás itt található.

Trend analysis (Fig. 1).

Today, the market will try to continue moving upward from the level of 1.3242 (closing of yesterday's daily candlestick) in order to reach the resistance line of 1.3309 (white bold line). If this line is tested, further upward movement with the target of 1.3380 is the upper border of the Bollinger line indicator (black dotted line).

Exchange Rates 18.11.2020 analysis

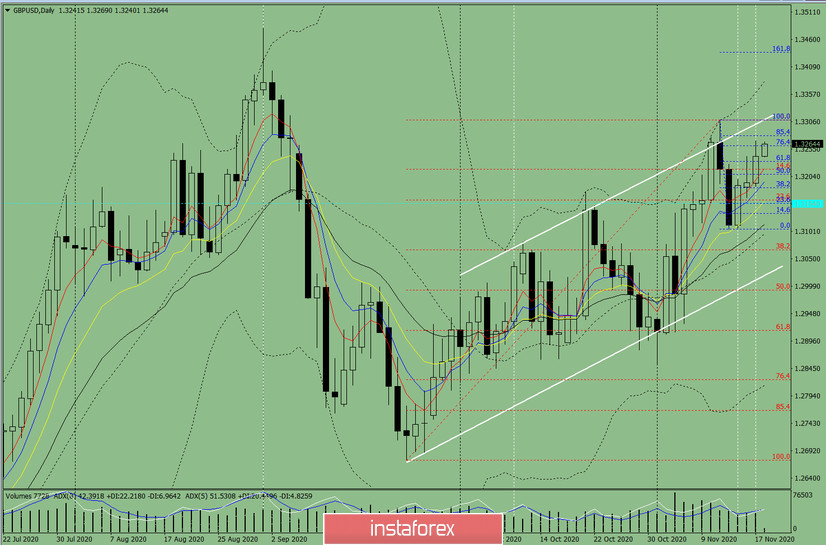
Figure 1 (Daily Chart).

Comprehensive analysis:

  • Indicator analysis - up
  • Fibonacci levels - up
  • Volumes - up
  • Candlestick analysis - down
  • Trend analysis - up
  • Bollinger bands - up
  • Weekly chart - up

General conclusion:

Today, the price will try to continue moving upward from the level of 1.3242 (closing of yesterday's daily candlestick) to reach the resistance line of 1.3309 (white bold line). If this line is tested, further upward movement with the target of 1.3380 is the upper border of the Bollinger line indicator (black dotted line).

Unlikely scenario: the price will try to continue moving upward from the level of 1.3242 (closing of yesterday's daily candlestick) to reach the resistance line of 1.3309 (white bold line). If this line is tested, it will work down to the target of 1.3216 with a 14.6% pullback level (red dotted line).

Stefan Doll
Analytical expert of InstaForex
© 2007-2024

Open trading account

InstaForex analytical reviews will make you fully aware of market trends! Being an InstaForex client, you are provided with a large number of free services for efficient trading.


Most elhagyja a www.instaforex.eu weblapot, amelyet az Instant Trading EU LTD üzemeltet
Can't speak right now?
Ask your question in the chat.

Turn "Do Not Track" off