 Zůstat
Obchodní podmínky
Nástroje


Trend analysis (Fig. 1).
Today, the market will try to continue moving upward from the level of 1.3242 (closing of yesterday's daily candlestick) in order to reach the resistance line of 1.3309 (white bold line). If this line is tested, further upward movement with the target of 1.3380 is the upper border of the Bollinger line indicator (black dotted line).
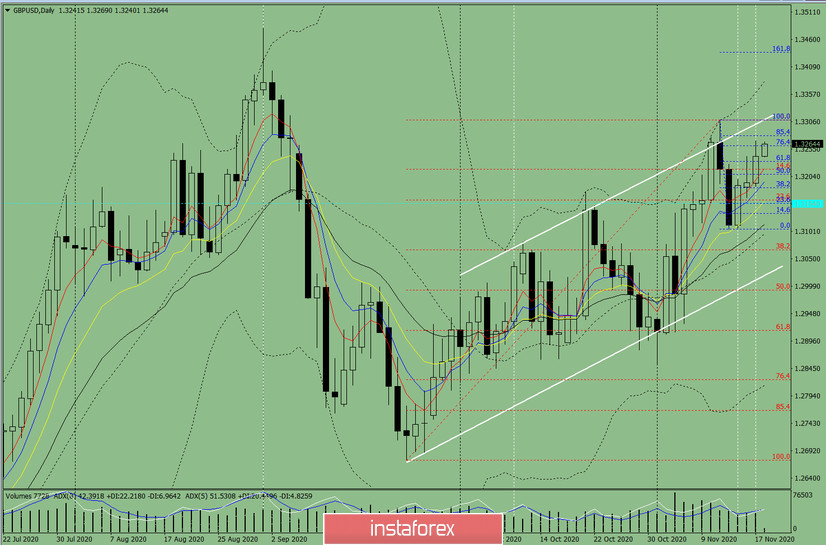
Figure 1 (Daily Chart).
Comprehensive analysis:
General conclusion:
Today, the price will try to continue moving upward from the level of 1.3242 (closing of yesterday's daily candlestick) to reach the resistance line of 1.3309 (white bold line). If this line is tested, further upward movement with the target of 1.3380 is the upper border of the Bollinger line indicator (black dotted line).
Unlikely scenario: the price will try to continue moving upward from the level of 1.3242 (closing of yesterday's daily candlestick) to reach the resistance line of 1.3309 (white bold line). If this line is tested, it will work down to the target of 1.3216 with a 14.6% pullback level (red dotted line).
Díky analytickým přehledům společnosti InstaForex získáte plné povědomi o tržních trendech! Jako zákazníkovi společnosti InstaForex je Vám k dispozici velký počet bezplatných služeb umožňujících efektivní obchodování.


