 Permanecer
Condições de Negociações
Ferramentas


Trend analysis
The price from the level of 1.1962 (closing of the last weekly candlestick) may continue to rise this week to the target of 1.2010 – upper fractal (red dotted line), which is the weekly candle from 08/30/2020. Upon reaching this level, it can further rise towards the next target – pullback level of 76.4% (blue dotted line).
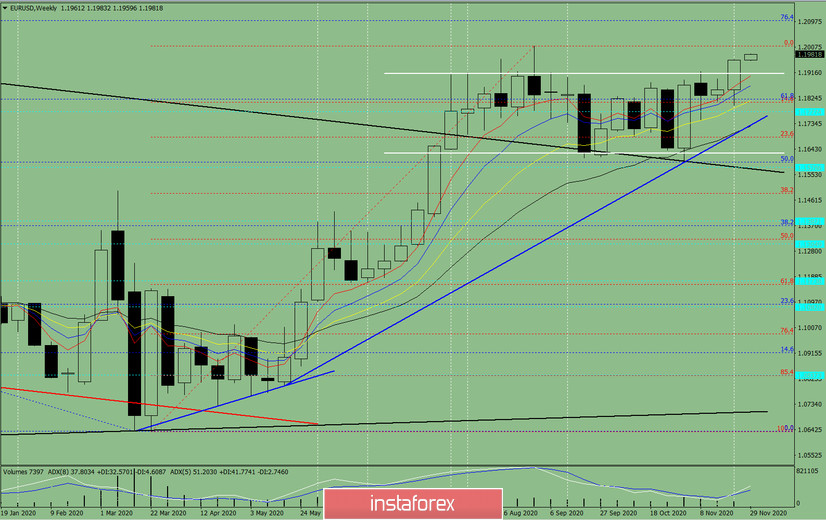
Figure 1 (weekly chart)
Comprehensive analysis:
- indicator analysis - up;
- Fibonacci levels - up;
- volumes - up;
- candlestick analysis - up;
- trend analysis - up;
- Bollinger lines - up;
- monthly chart - up.
An upward movement can be concluded based on comprehensive analysis.
The overall result of the candlestick calculation on the weekly chart: the price is likely to have an upward trend this week, with no lower shadow in the weekly white candlestick (Monday - up) and no upper shadow (Friday - up).
The first upper target is 1.2010 – the upper fractal (red dotted line), which is also the weekly candle from 08/30/2020. If this level is reached, the pair can continue to move upwards to the pullback level of 76.4% (blue dotted line).
An alternative scenario: from the level of 1.1962 (closing of the last weekly candlestick), rising to the next target of 1.2010 – the upper fractal (red dashed line), which is the weekly candle from 08/30/2020, is possible. After reaching this level, working downwards to the target support level of 1.1910 (white thick line) can be considered.
InstaForex analytical reviews will make you fully aware of market trends! Being an InstaForex client, you are provided with a large number of free services for efficient trading.

