 Zůstat
Obchodní podmínky
Nástroje


Trend analysis
The price from the level of 1.1962 (closing of the last weekly candlestick) may continue to rise this week to the target of 1.2010 – upper fractal (red dotted line), which is the weekly candle from 08/30/2020. Upon reaching this level, it can further rise towards the next target – pullback level of 76.4% (blue dotted line).
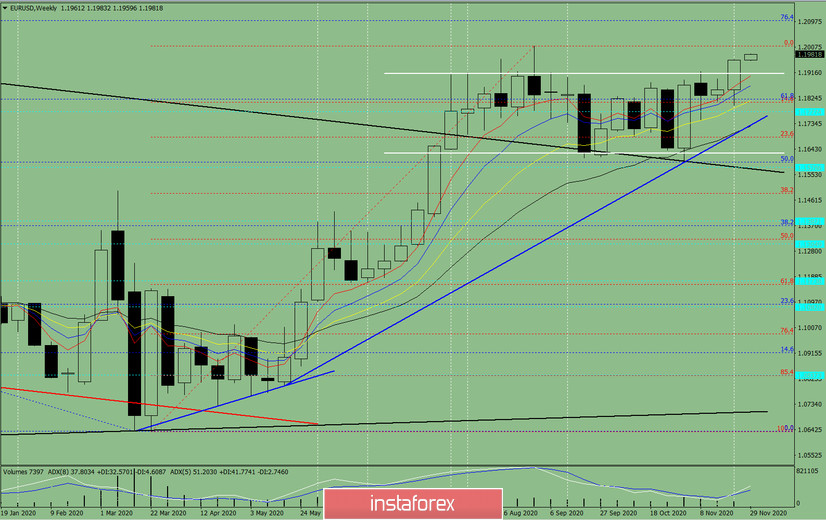
Figure 1 (weekly chart)
Comprehensive analysis:
- indicator analysis - up;
- Fibonacci levels - up;
- volumes - up;
- candlestick analysis - up;
- trend analysis - up;
- Bollinger lines - up;
- monthly chart - up.
An upward movement can be concluded based on comprehensive analysis.
The overall result of the candlestick calculation on the weekly chart: the price is likely to have an upward trend this week, with no lower shadow in the weekly white candlestick (Monday - up) and no upper shadow (Friday - up).
The first upper target is 1.2010 – the upper fractal (red dotted line), which is also the weekly candle from 08/30/2020. If this level is reached, the pair can continue to move upwards to the pullback level of 76.4% (blue dotted line).
An alternative scenario: from the level of 1.1962 (closing of the last weekly candlestick), rising to the next target of 1.2010 – the upper fractal (red dashed line), which is the weekly candle from 08/30/2020, is possible. After reaching this level, working downwards to the target support level of 1.1910 (white thick line) can be considered.
Díky analytickým přehledům společnosti InstaForex získáte plné povědomi o tržních trendech! Jako zákazníkovi společnosti InstaForex je Vám k dispozici velký počet bezplatných služeb umožňujících efektivní obchodování.


