 Permanecer
Condições de Negociações
Ferramentas


Trend analysis
The price from the level of 1.3673 (closing of the last weekly candlestick) is expected to rise to the target of 1.3802 - the historical resistance level (blue dotted line) this week. After reaching this level, it may further rise to the target of 1.3844 - the pullback level of 61.8% (yellow dotted line), from which a downward movement is likely.
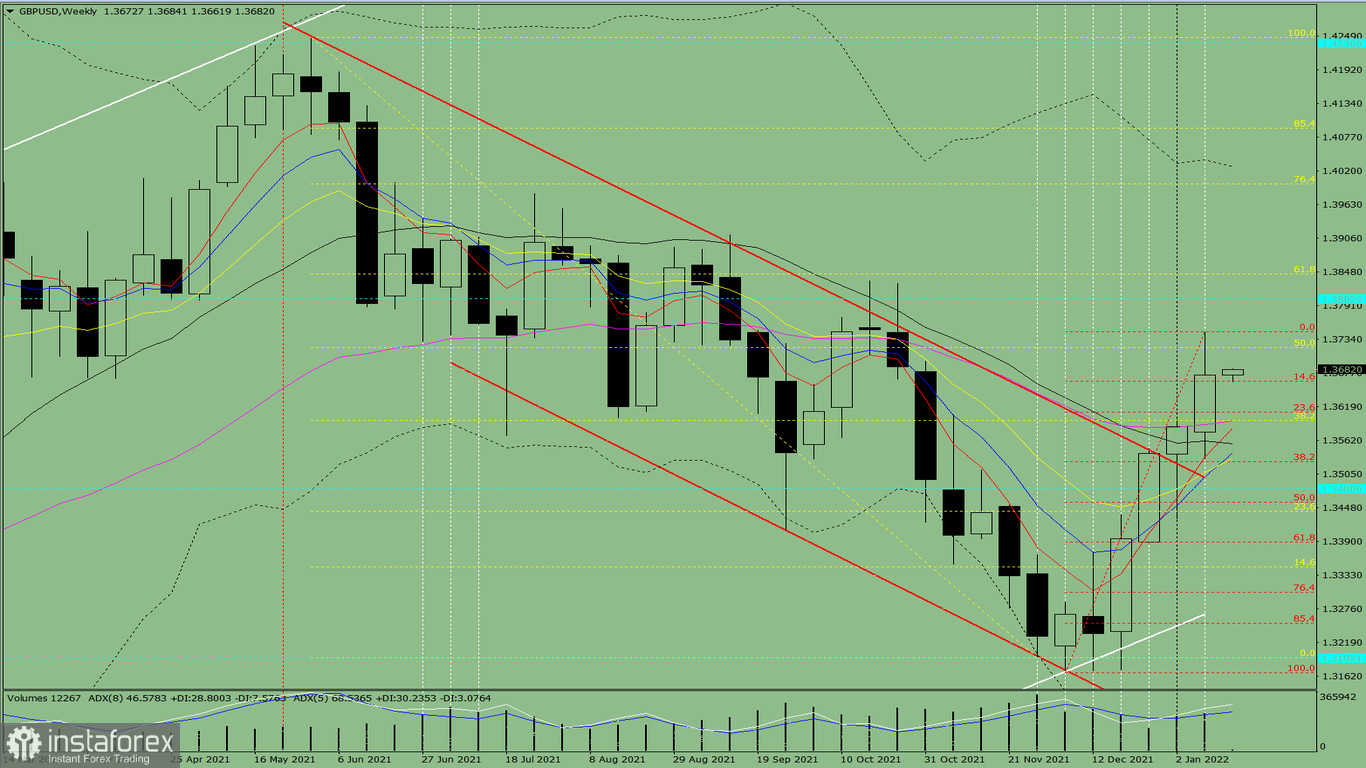
Fig 1 (weekly chart)
Comprehensive analysis:
An upward movement can be concluded based on a comprehensive analysis.
The overall result of the candlestick calculation based on the weekly chart: the price will most likely move in an upward trend both without the first lower shadow (Monday - up) and without the second upper shadow (Friday - up) in the weekly white candlestick.
This week, the price from the level of 1.3673 (closing of the last weekly candlestick) will increase to the target of 1.3802 - the historical resistance level (blue dotted line). Once this level is reached, the upward movement may resume to the target of 1.3844 - the pullback level of 61.8% (yellow dotted line). From this level, a downward movement is possible.
Alternatively, the price from the level of 1.3673 (closing of the last weekly candlestick) will decline to the target of 1.3662 - the pullback level of 4.6% (red dotted line). After reaching it, it can decline lower to the target of 1.3610 - the pullback level of 23.6% (red dotted line). If this level is tested, the upward movement can continue.
InstaForex analytical reviews will make you fully aware of market trends! Being an InstaForex client, you are provided with a large number of free services for efficient trading.


