 Zůstat
Obchodní podmínky
Nástroje


Trend analysis
The price from the level of 1.3673 (closing of the last weekly candlestick) is expected to rise to the target of 1.3802 - the historical resistance level (blue dotted line) this week. After reaching this level, it may further rise to the target of 1.3844 - the pullback level of 61.8% (yellow dotted line), from which a downward movement is likely.
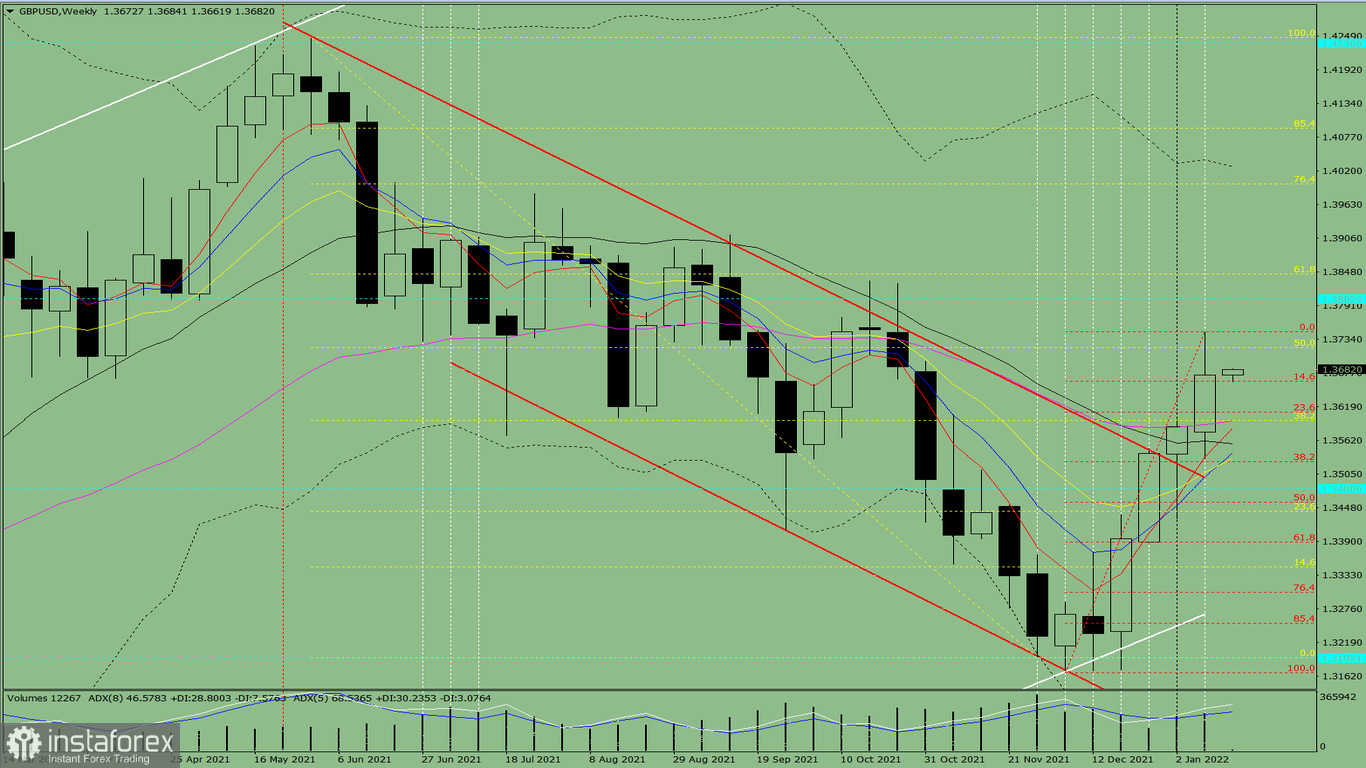
Fig 1 (weekly chart)
Comprehensive analysis:
An upward movement can be concluded based on a comprehensive analysis.
The overall result of the candlestick calculation based on the weekly chart: the price will most likely move in an upward trend both without the first lower shadow (Monday - up) and without the second upper shadow (Friday - up) in the weekly white candlestick.
This week, the price from the level of 1.3673 (closing of the last weekly candlestick) will increase to the target of 1.3802 - the historical resistance level (blue dotted line). Once this level is reached, the upward movement may resume to the target of 1.3844 - the pullback level of 61.8% (yellow dotted line). From this level, a downward movement is possible.
Alternatively, the price from the level of 1.3673 (closing of the last weekly candlestick) will decline to the target of 1.3662 - the pullback level of 4.6% (red dotted line). After reaching it, it can decline lower to the target of 1.3610 - the pullback level of 23.6% (red dotted line). If this level is tested, the upward movement can continue.
Díky analytickým přehledům společnosti InstaForex získáte plné povědomi o tržních trendech! Jako zákazníkovi společnosti InstaForex je Vám k dispozici velký počet bezplatných služeb umožňujících efektivní obchodování.

