 Permanecer
Condições de Negociações
Ferramentas


Trend analysis (Fig. 1).
The market may move upward from the level of 1.2433 (closing of yesterday's daily candle) with the target of 1.2492, the 50.0% pullback level (red dotted line). When testing this level, the price may move down with the target of 1.2460, the historical support level (blue dotted line).
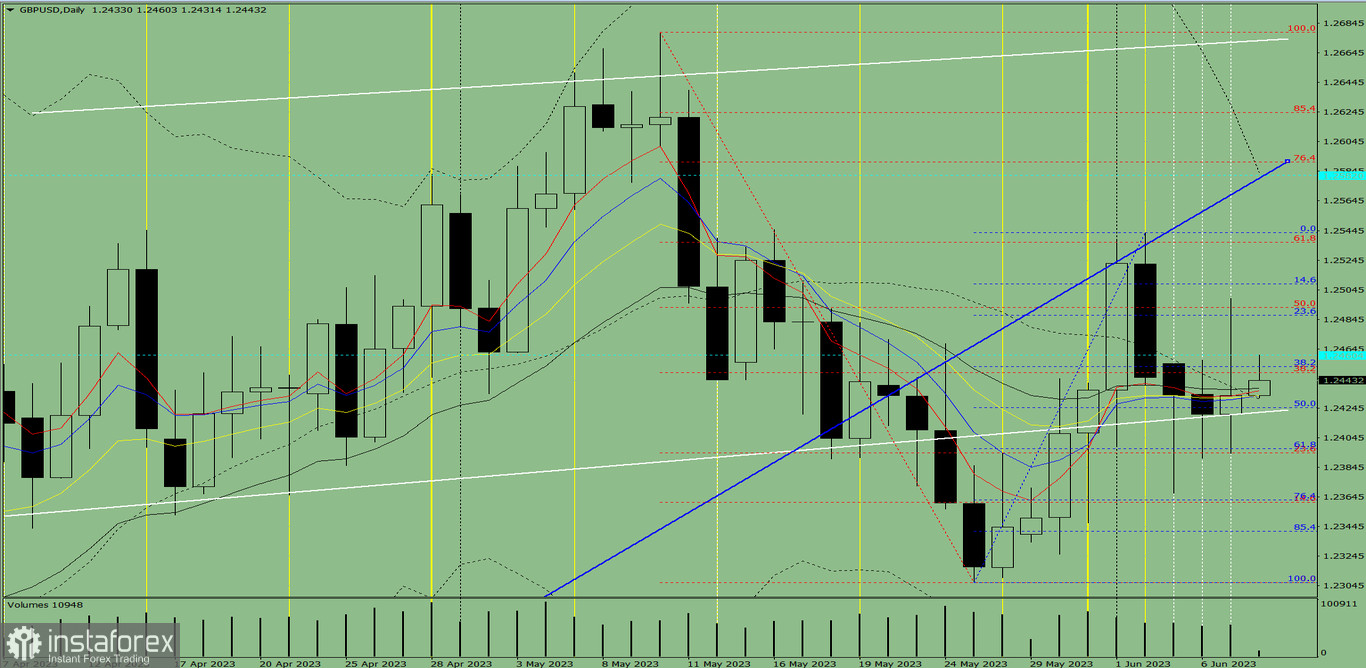
Fig. 1 (daily chart).
Comprehensive analysis:
General conclusion:
Today, the market may move upward from the level of 1.2433 (closing of yesterday's daily candle) with the target of 1.2492, the 50.0% pullback level (red dotted line). When testing this level, the price may move down with the target of 1.2460, the historical support level (blue dotted line).
Alternatively, the price may move upward from the level of 1.2433 (closing of yesterday's daily candle) with the target of 1.2460, the historical support level (blue dotted line). When testing this level, the price may move down with the target of 1.2425, the 50.0% pullback level (blue dotted line).
InstaForex analytical reviews will make you fully aware of market trends! Being an InstaForex client, you are provided with a large number of free services for efficient trading.


