 Permanecer
Condiciones de negociación
Products
Herramientas


Trend analysis (Fig. 1).
The market may move upward from the level of 1.2433 (closing of yesterday's daily candle) with the target of 1.2492, the 50.0% pullback level (red dotted line). When testing this level, the price may move down with the target of 1.2460, the historical support level (blue dotted line).
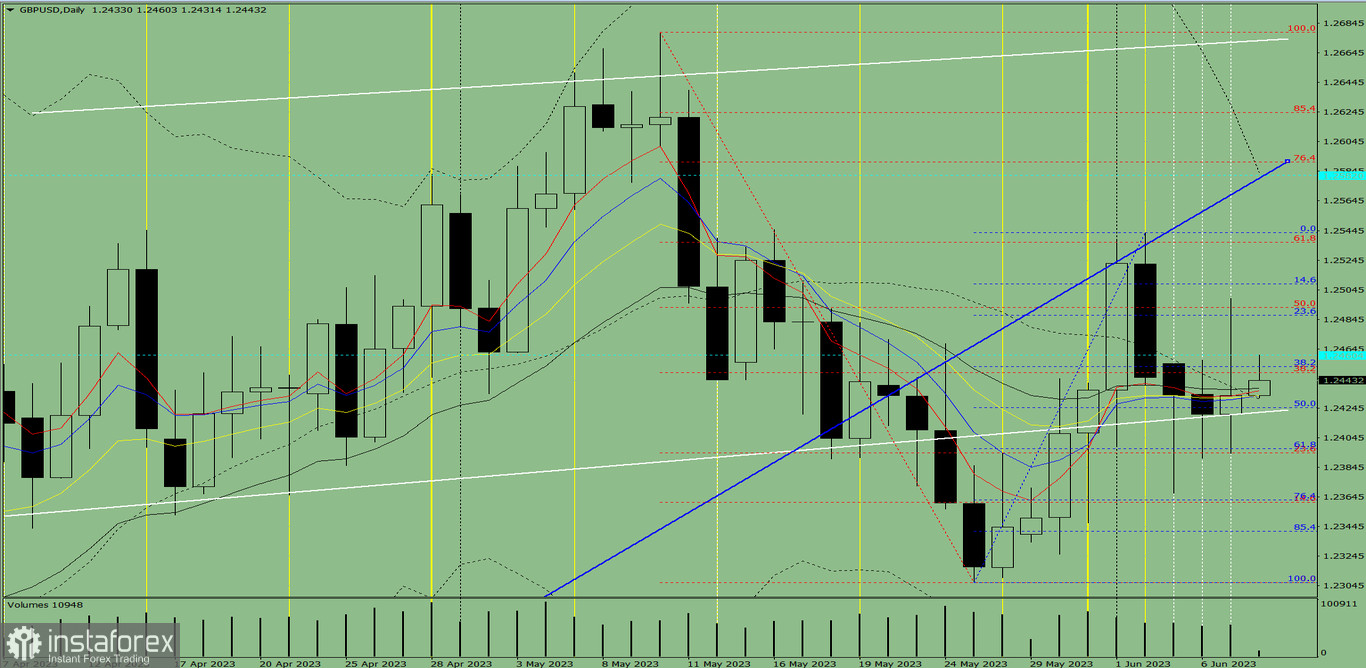
Fig. 1 (daily chart).
Comprehensive analysis:
General conclusion:
Today, the market may move upward from the level of 1.2433 (closing of yesterday's daily candle) with the target of 1.2492, the 50.0% pullback level (red dotted line). When testing this level, the price may move down with the target of 1.2460, the historical support level (blue dotted line).
Alternatively, the price may move upward from the level of 1.2433 (closing of yesterday's daily candle) with the target of 1.2460, the historical support level (blue dotted line). When testing this level, the price may move down with the target of 1.2425, the 50.0% pullback level (blue dotted line).
¡Los informes analíticos de InstaForex lo mantendrá bien informado de las tendencias del mercado! Al ser un cliente de InstaForex, se le proporciona una gran cantidad de servicios gratuitos para una operación eficiente.


