 Permanecer
Condições de Negociações
Ferramentas


Trend analysis (Fig. 1).
The EUR/USD currency pair may move upward from the level of 1.0991 (closing of yesterday's daily candle) to 1.1063, the historical resistance level (blue dotted line). In the case of testing this level, a downward movement is possible to the upper fractal at 1.1000 (daily candle from 28/11/2023).
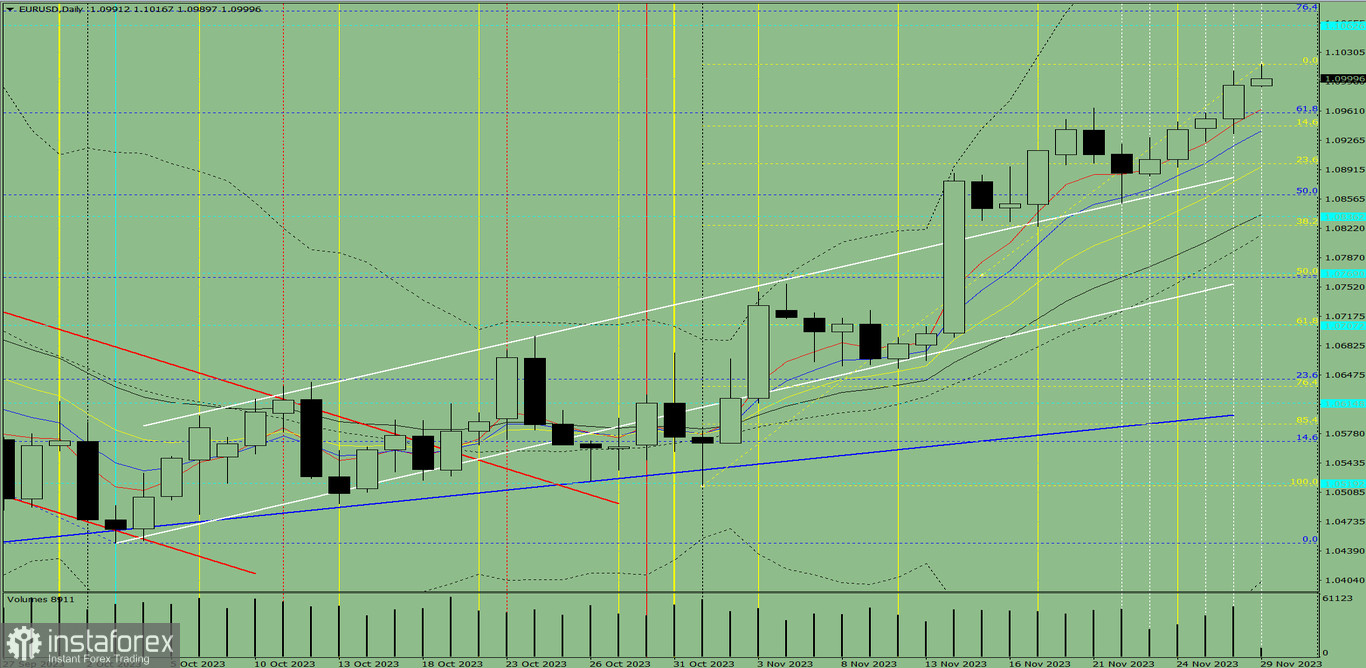
Fig. 1 (daily chart).
Comprehensive analysis:
General conclusion: Today, the price may move upward from the level of 1.0991 (closing of yesterday's daily candle) to 1.1063, the historical resistance level (blue dotted line). In the case of testing this level, a downward movement is possible to the upper fractal at 1.1000 (daily candle from 28/11/2023).
Alternatively, the price may move downward from the level of 1.0991 (closing of yesterday's daily candle) to 1.0959, the 61.8% pullback level (blue dotted line). In the case of testing this level, an upward movement is possible with a target of 1.1063, the historical resistance level (blue dotted line).
InstaForex analytical reviews will make you fully aware of market trends! Being an InstaForex client, you are provided with a large number of free services for efficient trading.


