 Zůstat
Obchodní podmínky
Nástroje


Trend analysis (Fig. 1).
The EUR/USD currency pair may move upward from the level of 1.0991 (closing of yesterday's daily candle) to 1.1063, the historical resistance level (blue dotted line). In the case of testing this level, a downward movement is possible to the upper fractal at 1.1000 (daily candle from 28/11/2023).
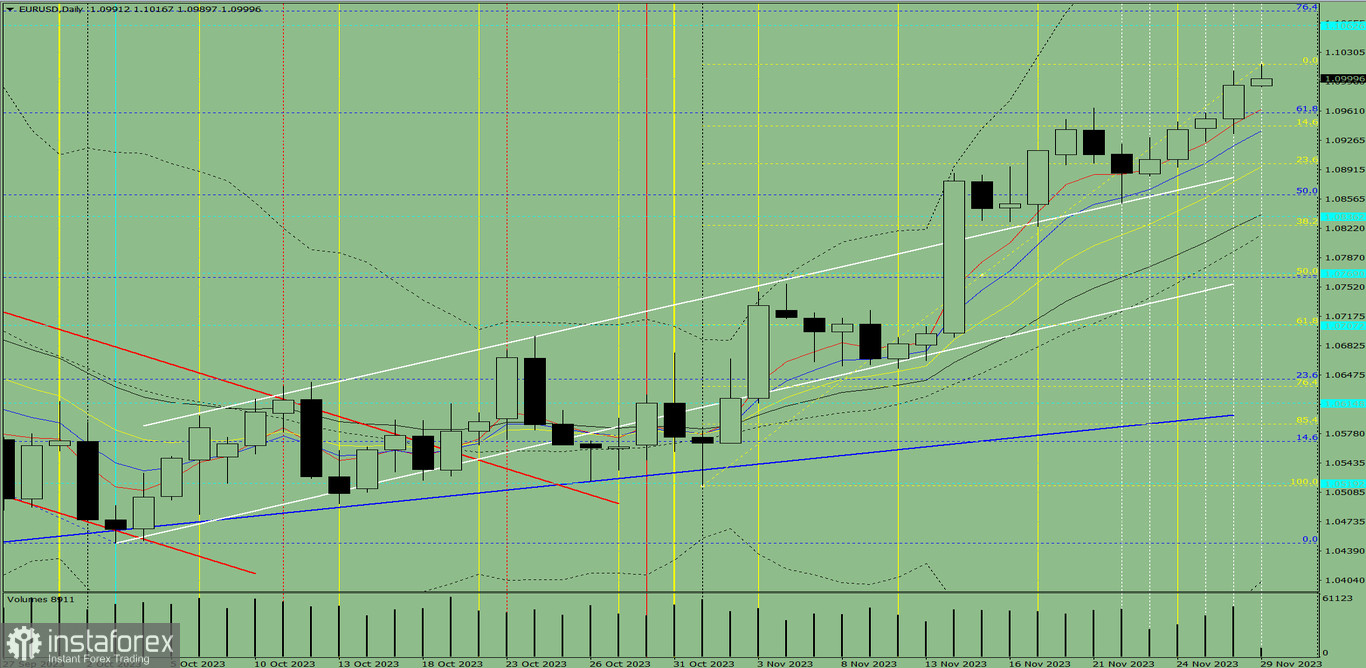
Fig. 1 (daily chart).
Comprehensive analysis:
General conclusion: Today, the price may move upward from the level of 1.0991 (closing of yesterday's daily candle) to 1.1063, the historical resistance level (blue dotted line). In the case of testing this level, a downward movement is possible to the upper fractal at 1.1000 (daily candle from 28/11/2023).
Alternatively, the price may move downward from the level of 1.0991 (closing of yesterday's daily candle) to 1.0959, the 61.8% pullback level (blue dotted line). In the case of testing this level, an upward movement is possible with a target of 1.1063, the historical resistance level (blue dotted line).
Díky analytickým přehledům společnosti InstaForex získáte plné povědomi o tržních trendech! Jako zákazníkovi společnosti InstaForex je Vám k dispozici velký počet bezplatných služeb umožňujících efektivní obchodování.


