 Permanecer
Condiciones de negociación
Products
Herramientas


The daily chart of EUR/USD is signaling that it is rounding out the final stages of a classic head-and-shoulder reversal price pattern. Figure #1 below shows all the components of the reversal that took place in mid-February of 2018 (the head of the pattern). Since then, the EUR/USD pair has been on a strong downtrend, as can be seen on the same chart. The 21-day moving average has had a downward slope most of the time since the head of the pattern occurred. When the 21-day moving average turns upward, the price usually rises for one to two months, and then resumes on its downtrend. This is also seen on the daily chart. One important observation regarding the head-and-shoulder pattern is that although EUR/USD has been on a strong downtrend, it has to breach the neckline yet.
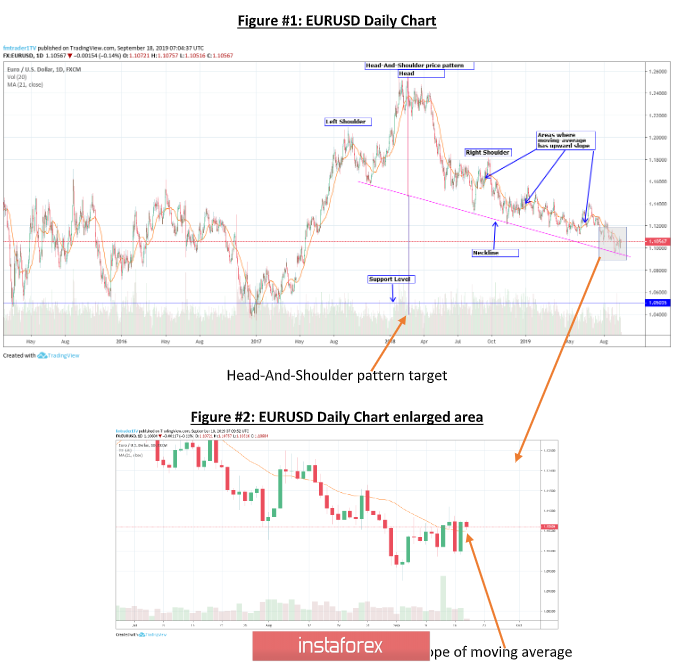
Analyzing these charts together, there are two significant rermarks. First, the neckline is about to be breached to the downside. All the while, the downtrend line on the 1-hour chart has been tested, but a breakthrough has not occurred yet. At present, price is swinging away from it to the downside. If price makes a new low on the downtrend shown on the 1-hour chart, while at the same time the neckline is breached on the daily chart, the next support level is at the 100% retracement level of the uptrend that took place at the beginning of 2017 and ended with the head-and-shoulder reversal price pattern where EUR/USD is currently in the midst of. The price is near the target for a reversal pattern. This is definitely a setup for a short trade.
On the other hand, if price breaks above the downtrend line on the 1-hour chart, the 21-day moving average begins showing a positive slope, then a setup for long trade may be a better option. The next few days should confirm which option is best.
¡Los informes analíticos de InstaForex lo mantendrá bien informado de las tendencias del mercado! Al ser un cliente de InstaForex, se le proporciona una gran cantidad de servicios gratuitos para una operación eficiente.


