 Permanecer
Condiciones de negociación
Products
Herramientas


Overview:
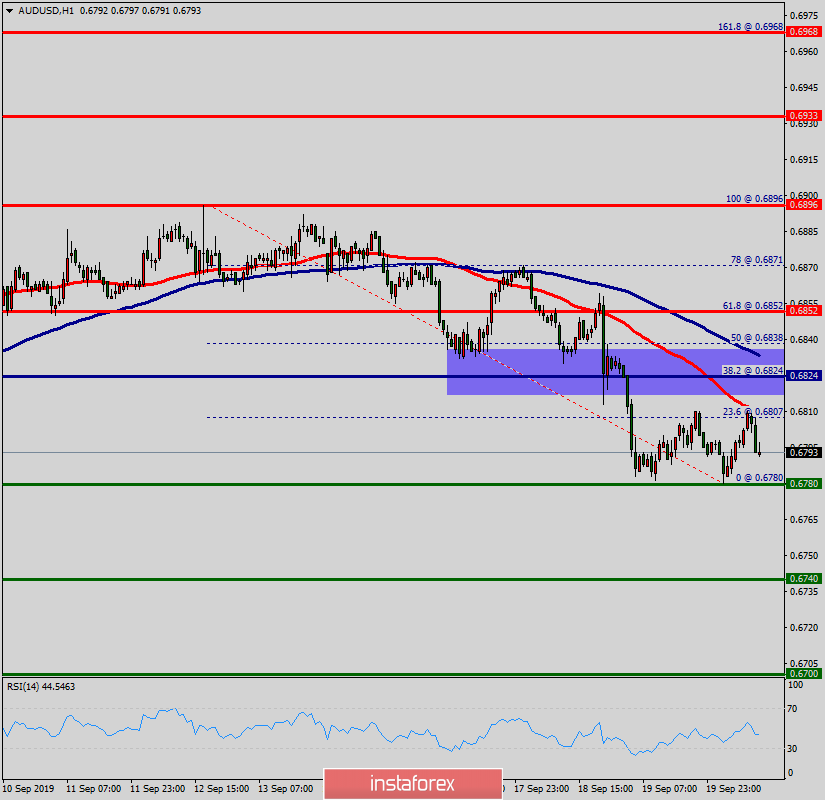
The downtrend of AUD/USD pair is still prominent in the In the 1-hour time frame.
The AUD/USD pair shows us the former's quick decline since yesterday. The current areas on this chart are the lowest since Decemeber 16th, 2019. High resistance of AUD/USD pair is supposedly the zone of 0.6824, while low support is less clear (0.6780 or 0.6740).
Intraday resistance level seen is at the 0.6824 price. The level of 0.6824 is coincided with the 38.2% of Fibonacci retracement areas here are based on the overall downward movement
The RSI indicator is directed downwards and the price range is extending, which indicates the continuation of the downtrend. The RSI is leaving the overbought zone having formed a sell signal.
100-Moving average is in the negative spot keeping a strong sell signal fromthe levels of 0.6824 and 0.6852.
Technical indicators on the H1 chart the AUD/USD pair generally suggest slowing downward movement.
In other words, it will be a good sign to sell below the major key of today at the level of 0.6824 with a first target at 0.6780 in order to test the daily double bottom.
If the the price of the AUD/USD pair breaks down 0.6780 and closes below it on H1, the market will indicate a bearish opportunity below 0.6780 then the trend will move the pair further downwards to 0.6700. However, the stop loss should be placed below the low reached near R1 (0.6852).
Technical Analysis
Philosophy Buy-Sell in Forex
¡Los informes analíticos de InstaForex lo mantendrá bien informado de las tendencias del mercado! Al ser un cliente de InstaForex, se le proporciona una gran cantidad de servicios gratuitos para una operación eficiente.

