empty
 
 
Está a punto de salir de
www.instaforex.eu >
un sitio web operado por
INSTANT TRADING EU LTD
Abrir cuenta

25.09.201908:53 Forex Analysis & Reviews: Gold price recaptures short-term resistance levels

Esta información se proporciona a clientes minoristas y profesionales como parte de comunicación de marketing. No contiene y no debe interpretarse como asesoramiento o recomendación de inversión o una oferta o solicitud para participar en cualquier transacción o estrategia en instrumentos financieros. El desempeño pasado no garantiza o predice el desempeño futuro. Instant Trading EU Ltd. no asume ninguna representación ni responsabilidad sobre la precisión o integridad de la información proporcionada, o cualquier pérdida que surja de cualquier inversión basada en el análisis, pronóstico u otra información proporcionada por un empleado de la Compañía o de otra manera. El descargo de responsabilidad completo está disponible aquí.

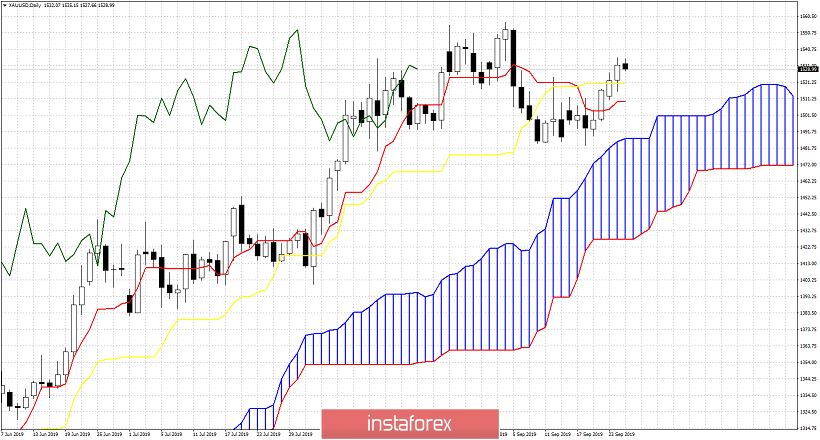
Gold price has broken above $1,520-25 short-term resistance area and must stay above it in order to continue to new 2019 highs. A reversal from the $1,530 area would be a bearish sign specially if price fails to hold $1,520-15.

Exchange Rates 25.09.2019 analysis

Red lines - bullish channel

Yellow rectangle -short-term resistance

Black line -RSI resistance

Gold price remains inside the medium-term bullish channel. Price has recently broken the yellow rectangle area and this is a bullish sign. Bulls need to continue to show signs of strength and price to continue to make higher highs and higher lows inside the channel. Otherwise we might be in danger of a reversal. Although price has broken through the short-term resistance area, the RSI is at the resistance trend line. This makes me feel uncomfortable being too optimistic despite the break of the $1,525 resistance. Bulls need to see the RSI also break the resistance.

Exchange Rates 25.09.2019 analysis

In Ichimoku cloud terms price breaking above both the tenkan- and kijun-sen is a bullish. However bulls need to stay above the yellow and red lines in order for price to continue higher. Major support at recent lows where we also find the upper cloud boundary. Breaking below $1,484 will be a major blow to the medium-term trend.
Desarrollado por un Alexandros Yfantis
experto de análisis de InstaForex
© 2007-2024

Abra una cuenta de operaciones

¡Los informes analíticos de InstaForex lo mantendrá bien informado de las tendencias del mercado! Al ser un cliente de InstaForex, se le proporciona una gran cantidad de servicios gratuitos para una operación eficiente.


Usted está ahora saliendo de www.instaforex.eu, un sitio web operado por INSTANT TRADING EU LTD
¿No puede hablar ahora mismo?
Ingrese su pregunta en el chat.

Turn "Do Not Track" off