empty
 
 
Está a punto de salir de
www.instaforex.eu >
un sitio web operado por
INSTANT TRADING EU LTD
Abrir cuenta

17.11.201923:58 Forex Analysis & Reviews: EURUSD bounce is underway as expected

Análisis a largo plazo
Esta información se proporciona a clientes minoristas y profesionales como parte de comunicación de marketing. No contiene y no debe interpretarse como asesoramiento o recomendación de inversión o una oferta o solicitud para participar en cualquier transacción o estrategia en instrumentos financieros. El desempeño pasado no garantiza o predice el desempeño futuro. Instant Trading EU Ltd. no asume ninguna representación ni responsabilidad sobre la precisión o integridad de la información proporcionada, o cualquier pérdida que surja de cualquier inversión basada en el análisis, pronóstico u otra información proporcionada por un empleado de la Compañía o de otra manera. El descargo de responsabilidad completo está disponible aquí.

In previous we mentioned the increased probability of a bounce in EURUSD from the major Fibonacci retracement support level around 1.10. Price has bounced from 1.0988 low and the 61.8% Fibonacci retracement level.

Exchange Rates 17.11.2019 analysis

Green lines - bullish divergence

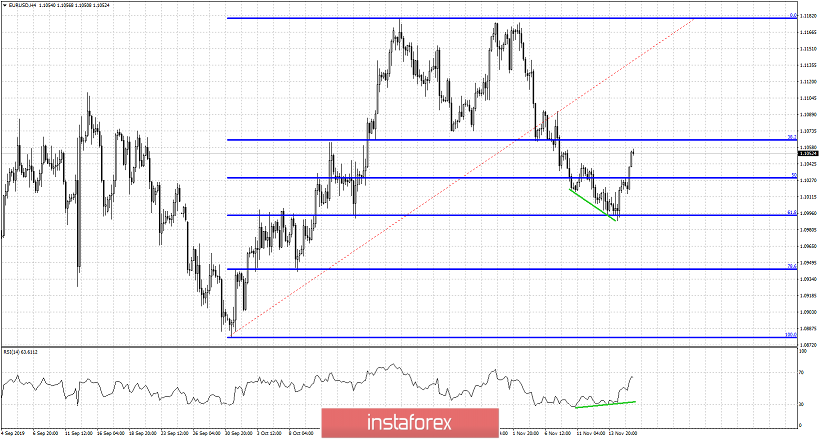
EURUSD ended the week at 1.1052 having bounced off the important Fibonacci support level we mentioned. Additionally we also noted that bullish divergence signs were evident in the 4 hour RSI and that was a warning for bears. This warning was a sign of increased chances of a bounce....The bounce came and it is now very important to see how this week unfolds. Has EURUSD made an equally important higher low relative to the October low of 1.0880. Is this the level where we see the start of a new upward wave that will eventually push price above 1.12?There are many chances of this happening.

Exchange Rates 17.11.2019 analysis

In Ichimoku cloud terms EURUSD is challenging short-term cloud resistance. Support is at 1.1020 and resistance at 1.1050. Trend remains bearish as price is below the 4 hour cloud. In order for the short-term trend to change to bullish price must break above the Kumo (cloud). Additionally bulls want price to continue making higher highs and higher lows as the tenkan-sen (red line indicator) is about to cross above the kijun-sen (green line indicator). This happening below the cloud is a weak bullish signal, but still a bullish one. So bears need to be cautious. A rejection at 1.1050 if followed by a weekly close below 1.0980 would be a bearish sign.
Desarrollado por un Alexandros Yfantis
experto de análisis de InstaForex
© 2007-2024

Abra una cuenta de operaciones

¡Los informes analíticos de InstaForex lo mantendrá bien informado de las tendencias del mercado! Al ser un cliente de InstaForex, se le proporciona una gran cantidad de servicios gratuitos para una operación eficiente.


Usted está ahora saliendo de www.instaforex.eu, un sitio web operado por INSTANT TRADING EU LTD
¿No puede hablar ahora mismo?
Ingrese su pregunta en el chat.

Turn "Do Not Track" off