 Permanecer
Condiciones de negociación
Products
Herramientas


As we explained in our previous posts, USDCAD had formed a bullish flag pattern and a break above 1.31 would lead to a move towards 1.3180 and the 61.8% Fibonacci retracement. This target has been reached and as price has broken above the 61.8% we take a look at our next target.
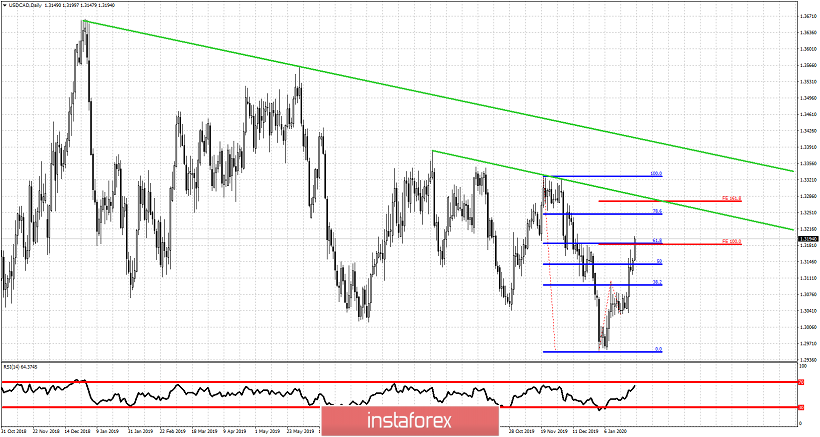
Red horizontal lines - Fibonacci extension targets
Blue horizontal lines - Fibonacci retracements
USDCAD has reached our first target and is now moving above the resistance of the 61.8% level. This could lead to a move towards the first green trend line resistance around 1.3270 where we also find the second Fibonacci extension target. Support is at 1.31-1.3085 and as long as price is above this level, bulls will remain in control of the trend.
¡Los informes analíticos de InstaForex lo mantendrá bien informado de las tendencias del mercado! Al ser un cliente de InstaForex, se le proporciona una gran cantidad de servicios gratuitos para una operación eficiente.


