 Permanecer
Condiciones de negociación
Products
Herramientas


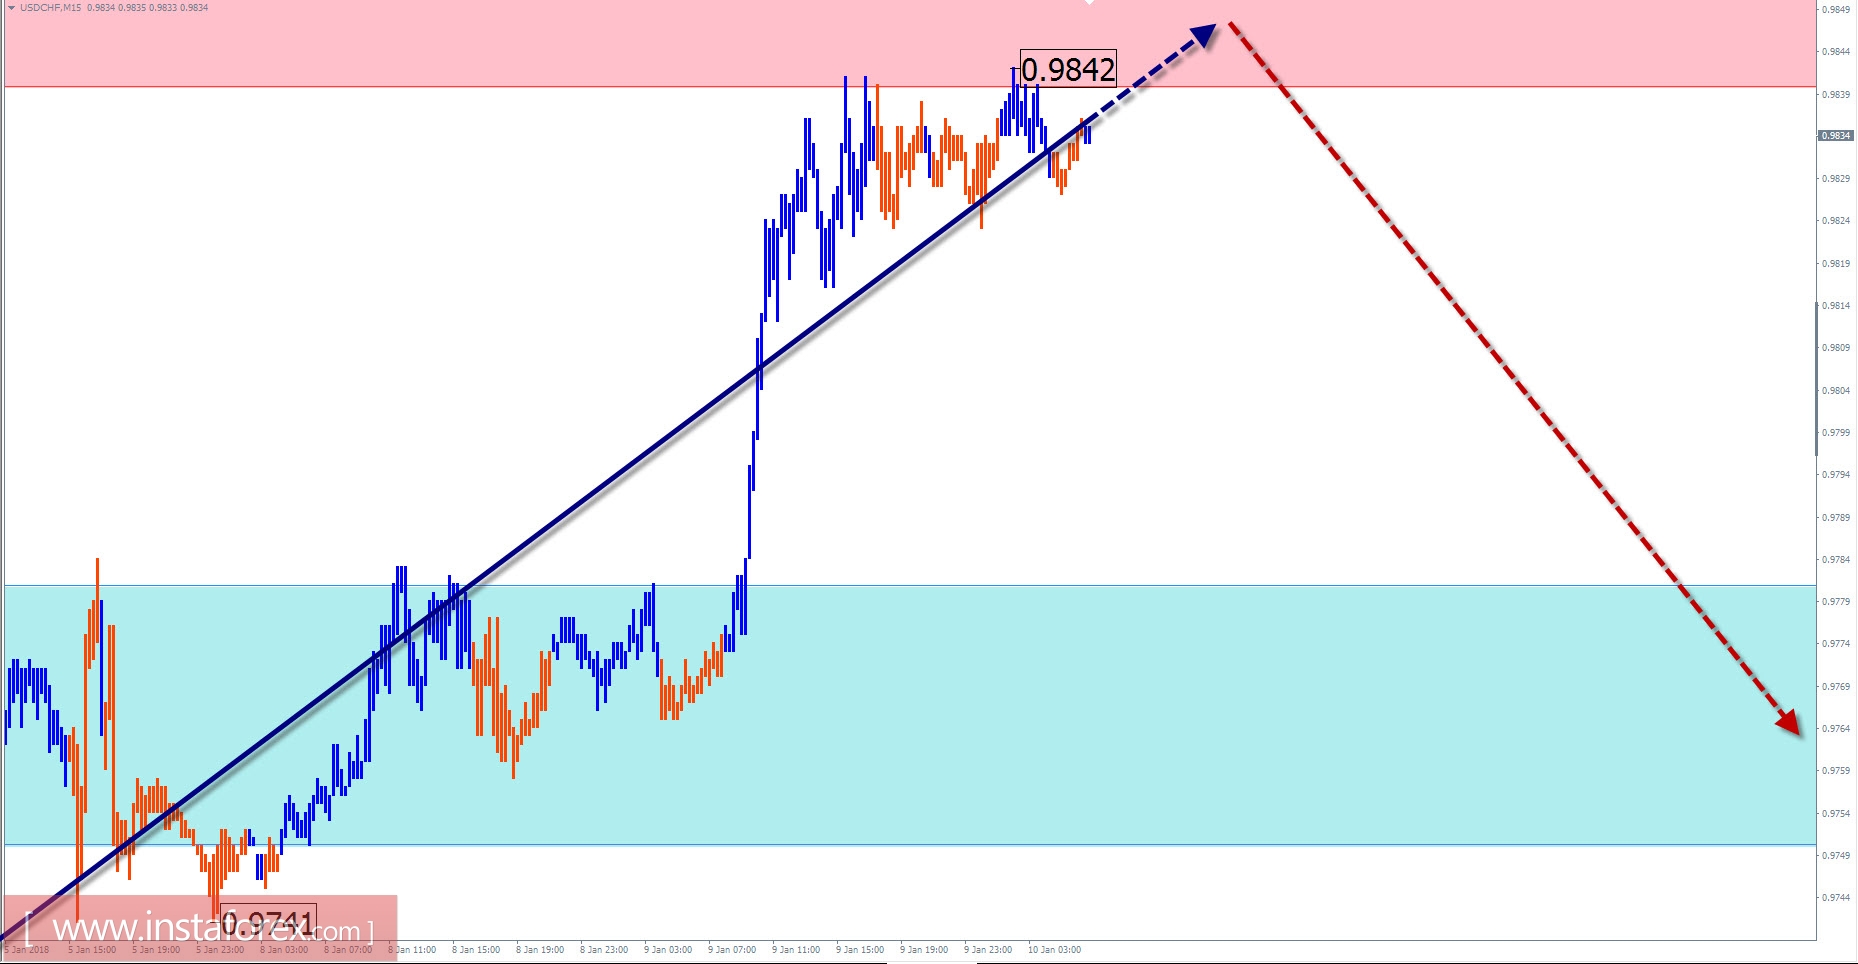
Review and forecast for USD / CHF
The weekly scale of the USD/CHF price chart shows the formation of a sideways plane in the past two years. The final section started in early September last year, from the lower boundary of the price channel. Currently, the completion of the middle part of the wave zigzag (B) was already completed in the structure. In early January, the price reached the upper limit of the calculated zone for the completion of the correction. The subsequent rise of the rate formed the first part of the potential reversal wave structure on the chart. There is a higher chance of changing the direction of short-term movement in the coming days.
It is expected that the price growth of the last days will be completed today along with the formation of a counter reversal. The nature of price fluctuations is likely to be flat. The support area demonstrates the most anticipated end of the turndown.
Boundaries of resistance zones:
- 0.9840 / 70
Boundaries of support zones:
- 0.9780 / 50
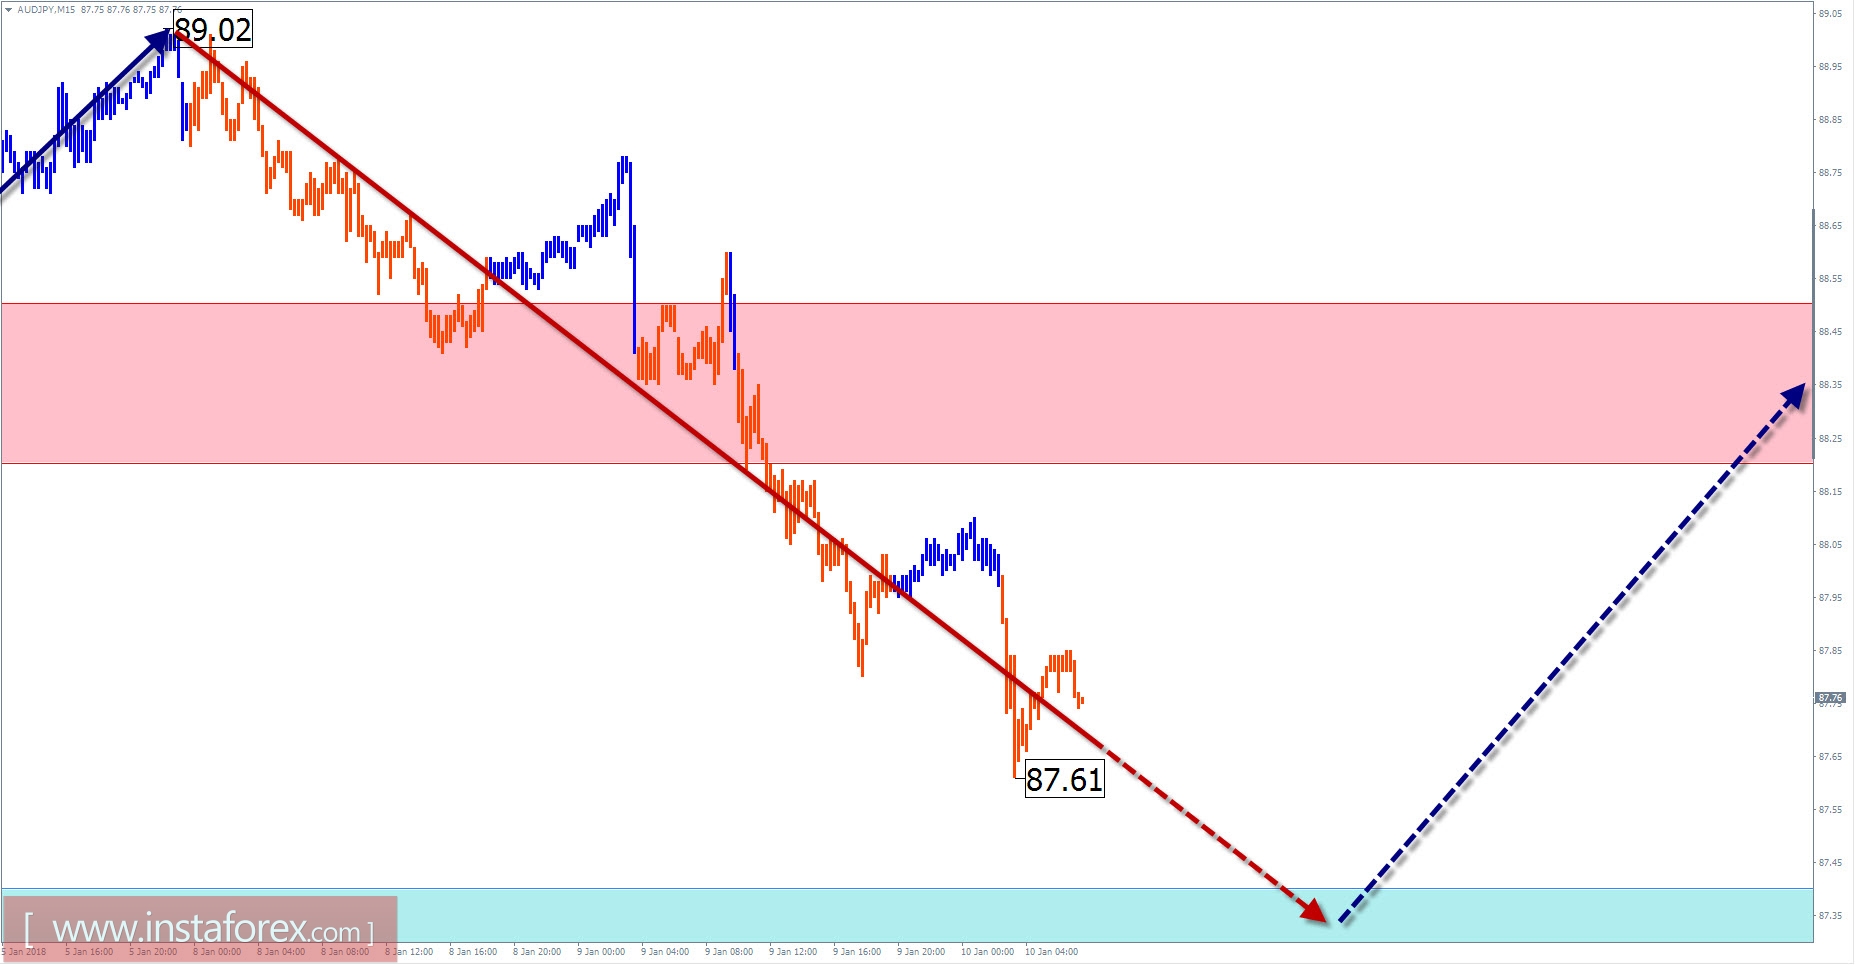
Review and Forecast for AUD / JPY
The daily scale chart of the cross pair AUD/JPY indicates an upward rate, as the prevailing direction of the price movement. The last unfinished section was the bullish wave of November 27 last year. The structure is formed in the pattern of a classical impulse. Three days ago, the price reduction completes the previously started hidden correction of the incorrect form. The preliminary calculation indicates the support zone in the form of a correction target.
Today, the full completion of the current decline is expected. A short-term breakthrough of the lower boundary of the estimated support is not ruled out, but the probability of this is low. Toward the end of the day, the chance of changing the direction of the pair's movement sharply increases. The upper limit of the daily stroke of the instrument will limit the resistance zones.
Boundaries of resistance zones:
- 88.20 / 50
Boundaries of support zones:
- 87.40 / 10
Explanations to the figures: For simplified wave analysis, a simple waveform is used that combines 3 parts (A; B; C). Of these waves, all kinds of correction are composed and most of the impulses. On each considered time frame the last and incomplete wave is analyzed.
The areas marked on the graphs are indicated by the calculation areas in which the probability of a change in the direction of motion is significantly increased. Arrows indicate the wave counting according to the technique used by the author. The solid background of the arrows indicates the structure formed, the dotted one indicates the expected wave motion.
Attention: The wave algorithm does not take into account the duration of the tool movements in time. The forecast is not a trading signal! To conduct a trade transaction, you need to confirm the signals of your trading systems.
* The presented market analysis is informative and does not constitute a guide to the transaction.
¡Los informes analíticos de InstaForex lo mantendrá bien informado de las tendencias del mercado! Al ser un cliente de InstaForex, se le proporciona una gran cantidad de servicios gratuitos para una operación eficiente.


