 Permanecer
Condiciones de negociación
Products
Herramientas


The current price decline in the past two months as shown on the cross chart easily completed the bearish wave on the larger scale. The entire wave adjusts the previous ascending section, which has been counting since June 2016. The structure of the bearish correction for today has reached the allowed minimum proportions, on which the completion is possible. Given the proximity of the nearest potential reversal zone, it is impossible to exclude the possibility of the entire bear wave ending in the coming weeks.
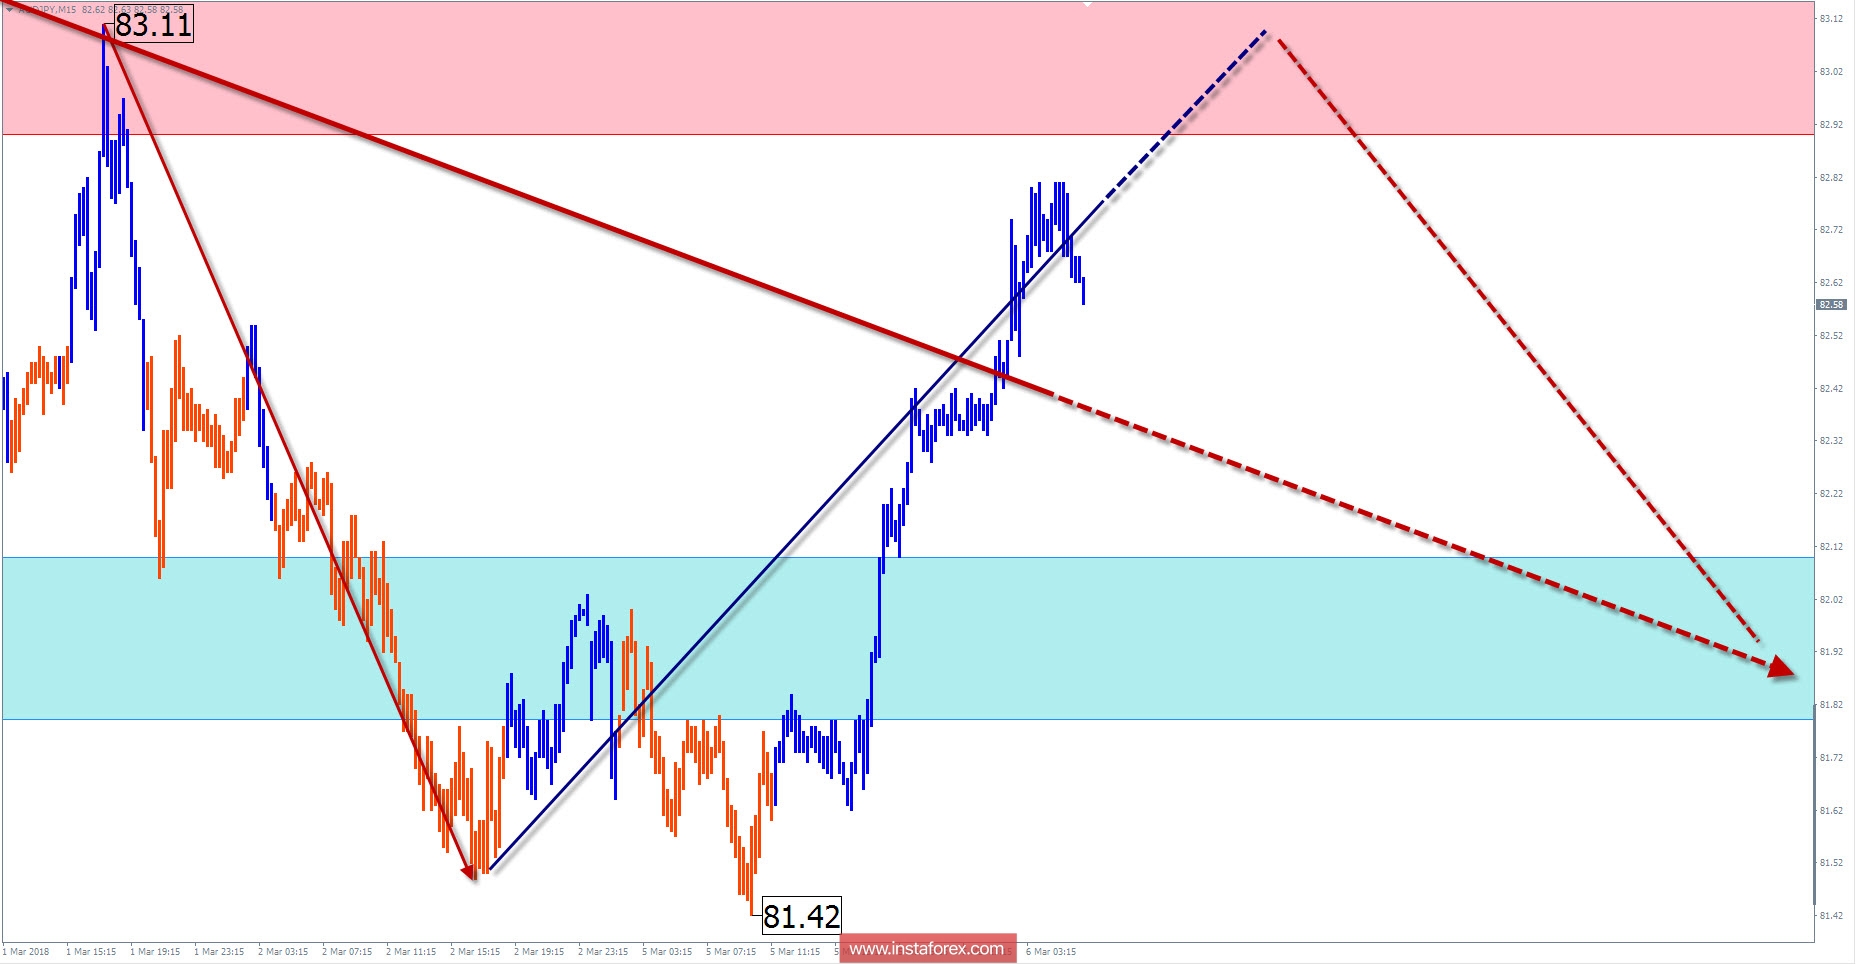
Today, there is a high probability that the growth of AUD/JPY price will begin yesterday. Within the framework of the calculated zone during the day, the formation of a reversal and the beginning of the downward course are expected. The active phase of the decline can be expected at the end of the day or tomorrow.
Boundaries of resistance zones:
- 82.90 / 83.20
Boundaries of support zones:
- 82.10 / 81.80
Explanations to the figures: For simplified wave analysis, the simplest type of wave is used in the form of a zigzag, combining 3 parts (A; B; C). Of these waves, all kinds of correction are composed and most of the impulses. At each time frame, the last, incomplete wave is analyzed.
The areas marked on the graphs are indicated by the calculation areas, where the probability of a change in the direction of motion is significantly increased. Arrows indicate the wave counting according to the technique used by the author. The solid background of the arrows indicates the structure formed, the dotted one indicates the expected wave motion.
Attention: The wave algorithm does not take into account the duration of the tool movements in time. The forecast is not a trading signal! To conduct a trade transaction, you need to confirm the signals of your trading systems.
* The presented market analysis is informative and does not constitute a guide to the transaction.
¡Los informes analíticos de InstaForex lo mantendrá bien informado de las tendencias del mercado! Al ser un cliente de InstaForex, se le proporciona una gran cantidad de servicios gratuitos para una operación eficiente.


