 Permanecer
Condiciones de negociación
Products
Herramientas


A leading countdown since August 2015, the rising wave of the instrument is approaching its final stage. In the structure of the wave, the first two parts (A; B) are formed by now, and the formation of the final section (C) has begun.
The reversal model started in November last year. Since February 16, the price began correction, not yet completed. The preliminary calculation of the target zone indicates as a guide in the middle of the seventieth price shape. The support zone closest to the current price level can significantly slow down the rate of decline or stop it altogether. The upcoming days will show which version of the development scenario is more realistic. In the event that the closest support will keep the quotes of the pair within its borders, the price is waiting for a turn and the beginning of intensive growth. Otherwise, before the turn, quotes will reach the next support zone.
The boundaries of resistance zones:
- 0.7320 / 0.7370
The boundaries of support zones:
- 0.7070 / 0.7020
- 0.6930 / 0.6880
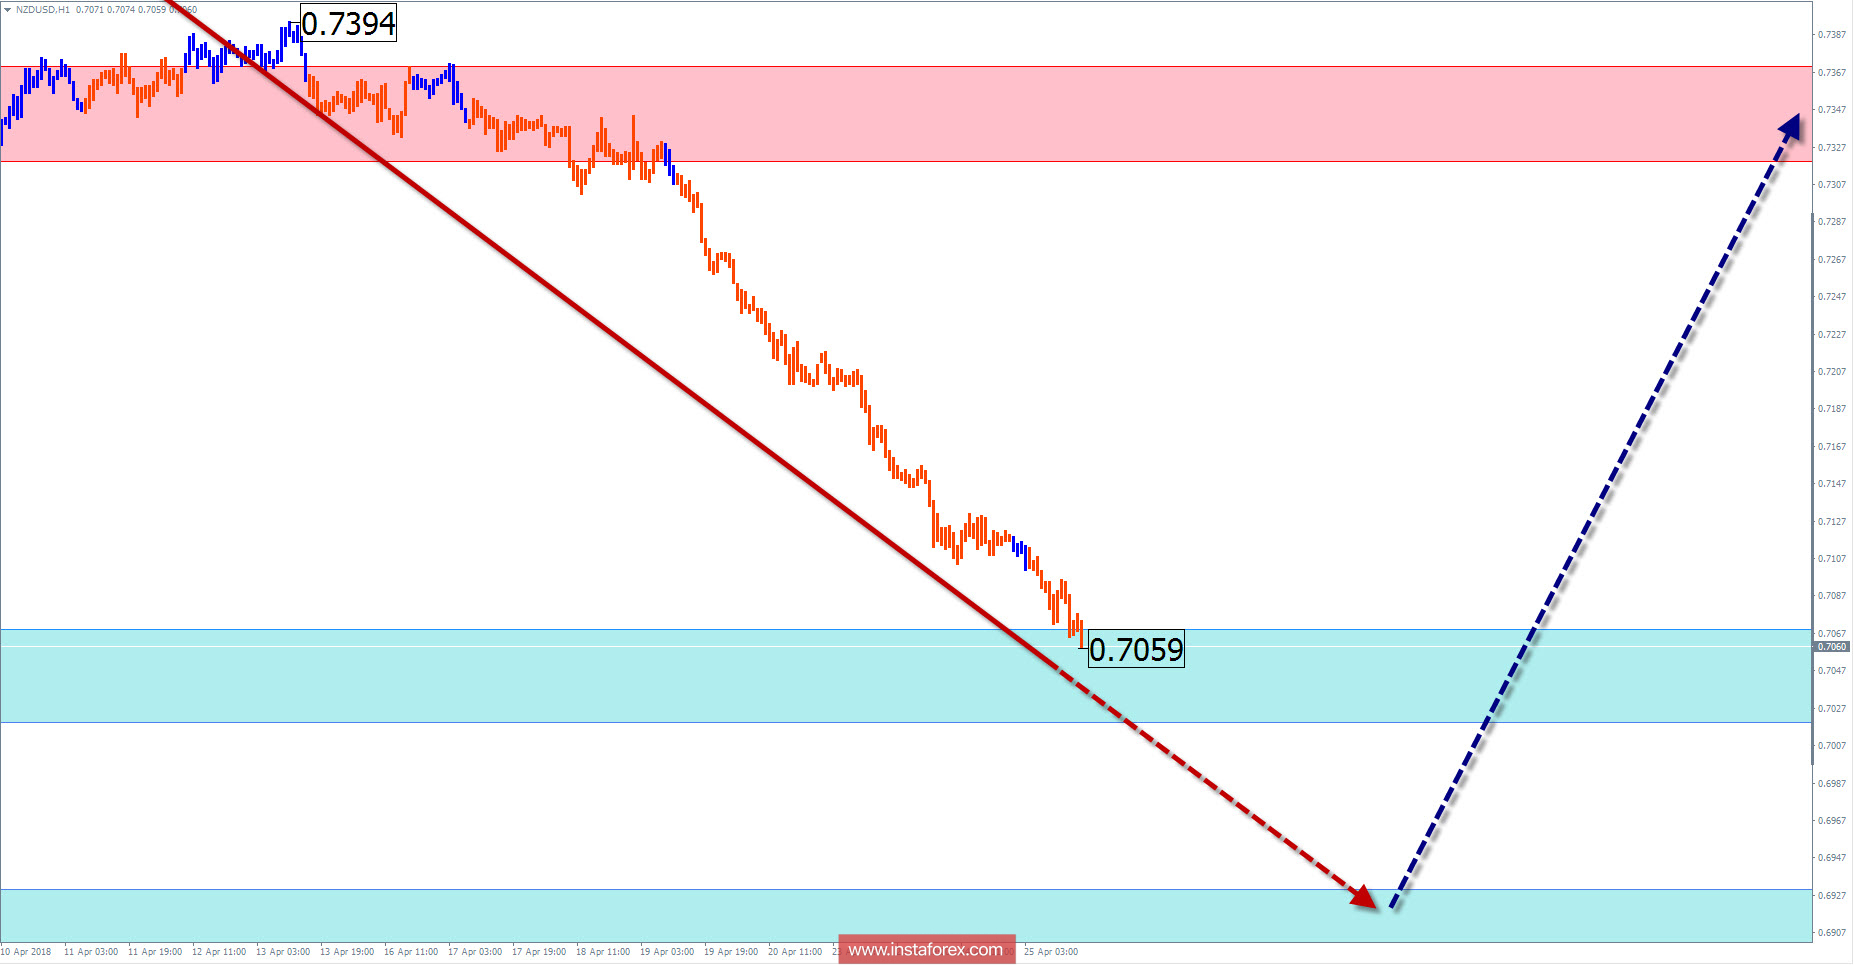
Explanations to the figures: For simplified wave analysis, the simplest type of wave is used in the form of a zigzag, combining 3 parts (A; B; C). Of these waves, all kinds of correction are composed and most of the impulses. At each time frame, the last, incomplete wave is analyzed.
The areas marked on the graphs are indicated by the calculation areas, where the probability of a change in the direction of motion is significantly increased. Arrows indicate the wave counting according to the technique used by the author. The solid background of the arrows indicates the structure formed, the dotted one indicates the expected wave motion.
Attention: The wave algorithm does not take into account the duration of the tool movements in time. The forecast is not a trading signal! To conduct a trade transaction, you need to confirm the signals of your trading systems.
¡Los informes analíticos de InstaForex lo mantendrá bien informado de las tendencias del mercado! Al ser un cliente de InstaForex, se le proporciona una gran cantidad de servicios gratuitos para una operación eficiente.

