 Permanecer
Condiciones de negociación
Products
Herramientas


Wave picture of the chart D1:
The last section of the graph on the H4 / D1 TF forms the beginning of the final part (C) in the larger ascending wave formation W1. Previous parts (A-B) were formed over 3 years.
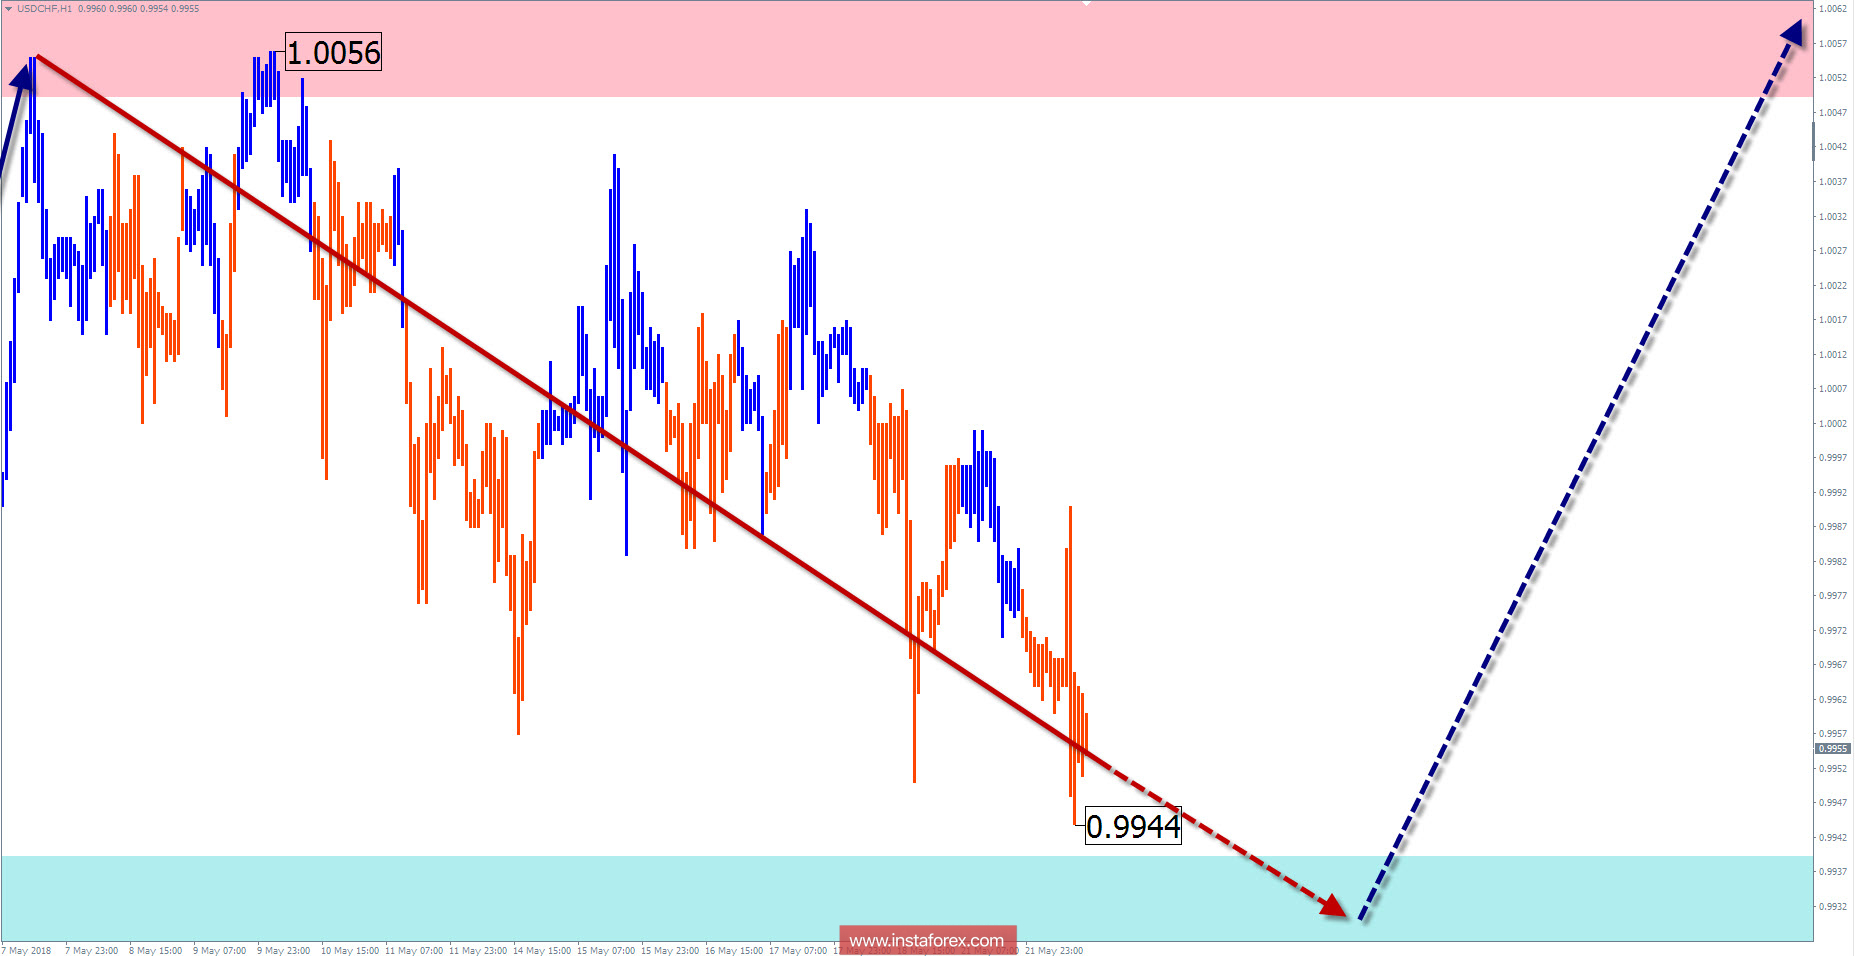
The wave pattern of the graph H1:
The bullish wave of February 16 has a high wave level. The character of the movement has a pronounced impulse form, with minimal counter correction areas. The lower boundary of the preliminary target zone is in 3 price figures from the current values of the pair.
The wave pattern of the M15 chart:
From May 7, the price is adjusted, forming an intermediate correction. The price is close to the upper boundary of the calculated completion zone.
Recommended trading strategy:
For all types of trade, only purchases are recommended. In the area of settlement support, it is possible to deposit or enter the market with minimal risk.
Resistance zones:
- 1.0050 / 1.0100
Support zones:
- 0.9940 / 0.9890
Explanations to the figures: Simplified wave analysis uses a simple waveform, in the form of a 3-part zigzag (ABC). At each TF the last incomplete wave is analyzed. Zones show the calculated areas with the greatest probability of a turn.
Arrows indicate the wave counting according to the technique used by the author. The solid background shows the generated structure, dotted - the expected wave motion.
Attention: The wave algorithm does not take into account the duration of the tool movements in time. To conduct a trade transaction, you need confirmation signals from your trading systems!
¡Los informes analíticos de InstaForex lo mantendrá bien informado de las tendencias del mercado! Al ser un cliente de InstaForex, se le proporciona una gran cantidad de servicios gratuitos para una operación eficiente.


