 Permanecer
Condiciones de negociación
Products
Herramientas


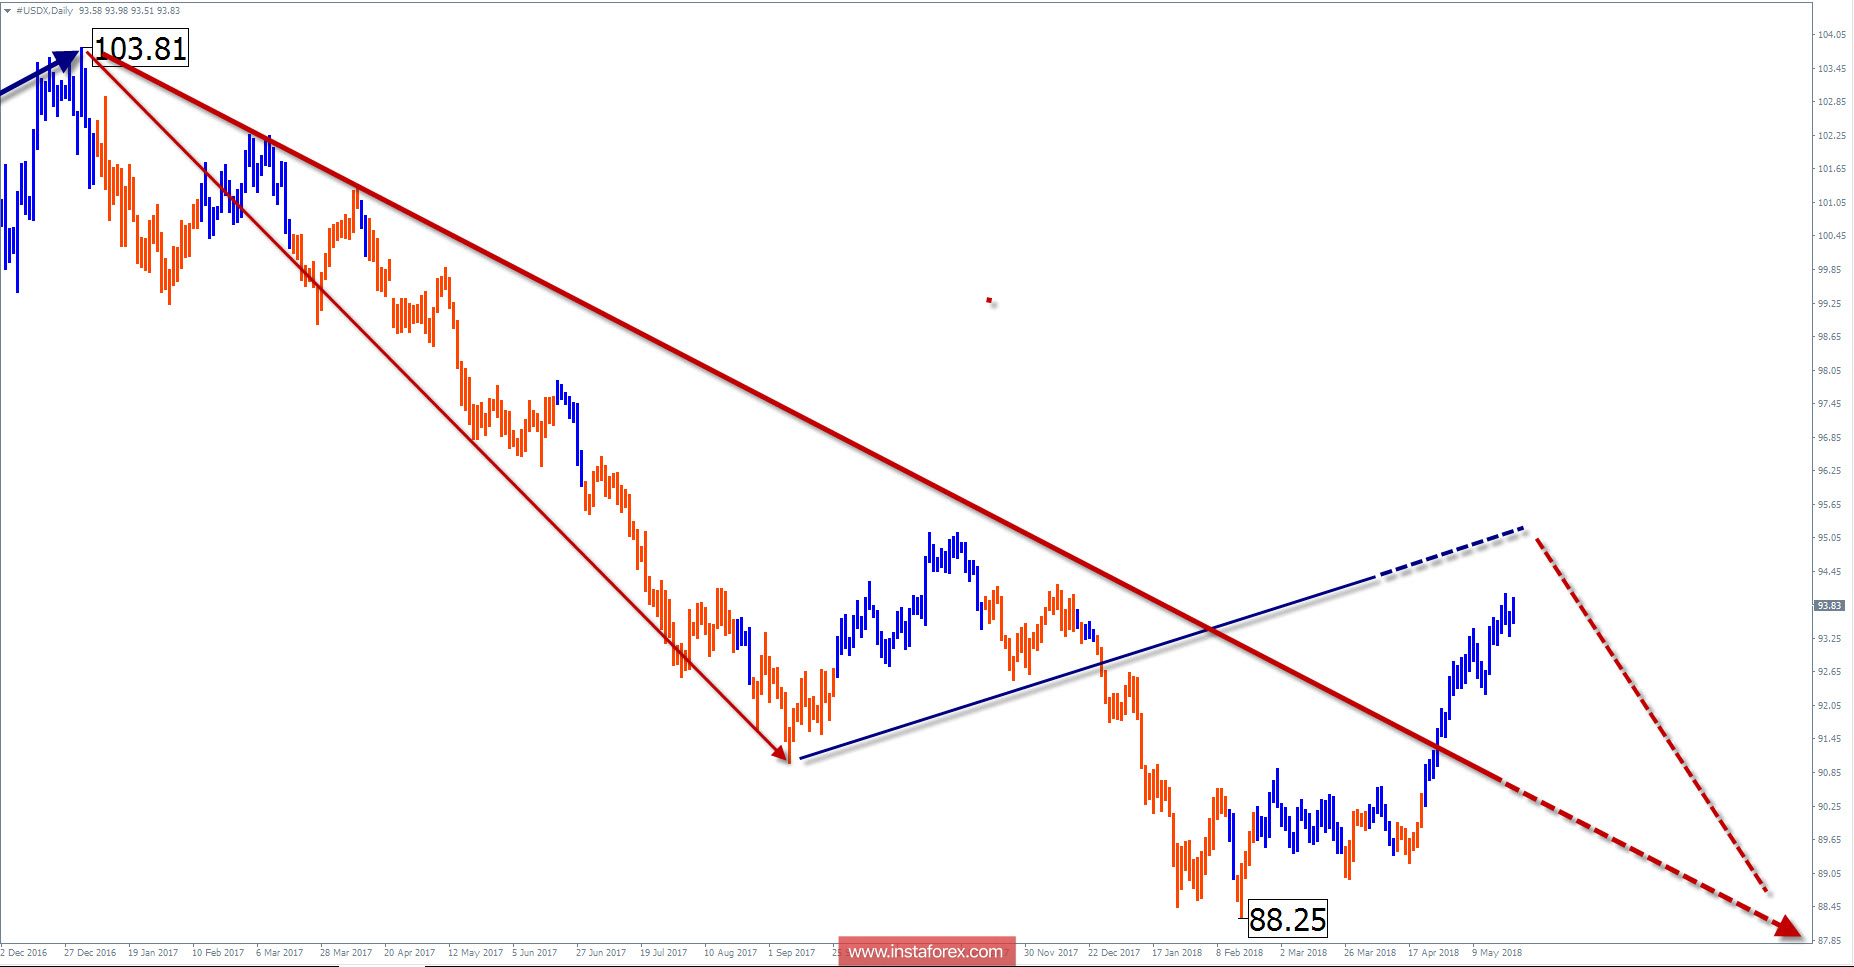
The wave pattern of the D1 graph:
The downward trend in the chart of the index observed since December 2016. In a larger wave model, this site took the place of the final part (C). Since January of this year, quotes are being rolled up, forming an intermediate correction within the wave.
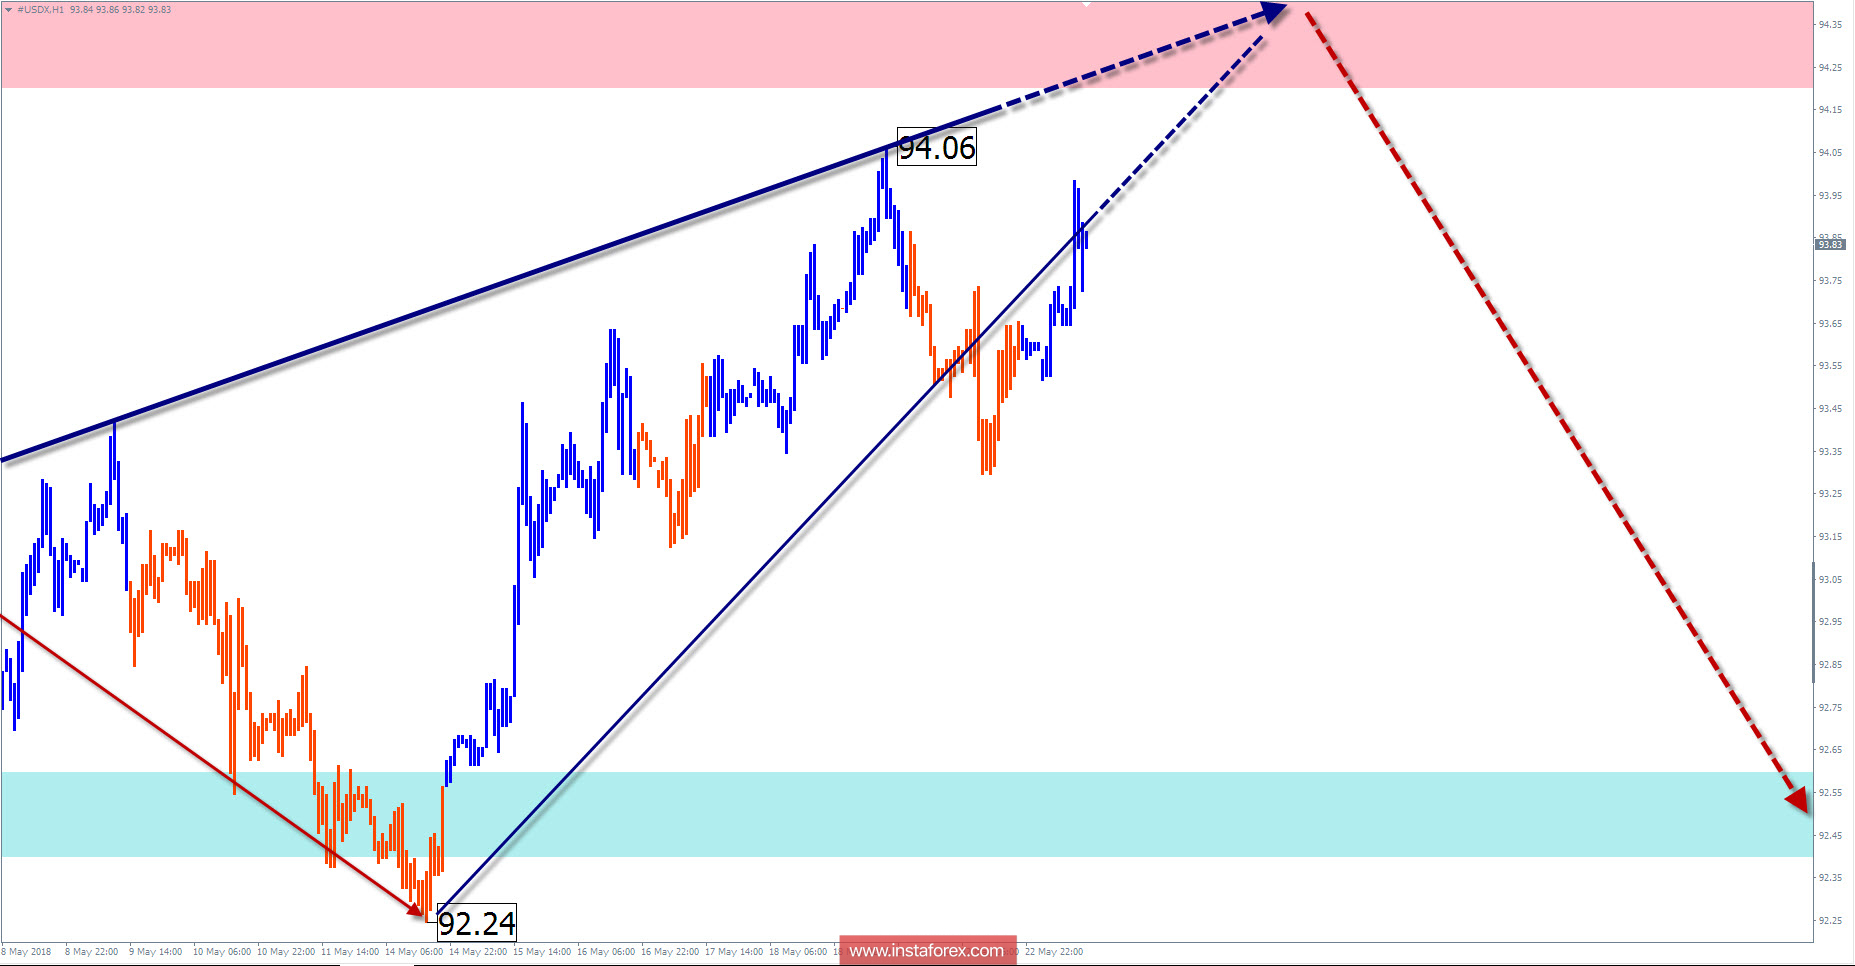
The wave pattern of the H1 graph:
The rising wave of the H1 / H4 scale is approaching the lower boundary of the preliminary target recovery zone. The width of the zone is around the price figure.
The wave pattern of the M15 chart:
Since May 14, the dollar quotation has gone up in growth, forming a new short-term wave. In its structure, a hidden correction is nearing completion, after which the final breakthrough of the course will follow.
Recommended trading strategy:
The dollar index acts as an indicator in determining the prospects for the trading of major pairs. Purchases can begin after the completion of the current recovery and confirmation of the dollar's turn.
Resistance zones:
- 94.20 / 94.40
Support zones:
- 92.60 / 92.40
Explanations to the figures:
A simplified wave analysis uses a simple waveform, in the form of a 3-part zigzag (ABC). The last incomplete wave for every timeframe is analyzed. Zones show the calculated areas with the greatest probability of a turn.
Arrows indicate the counting of wave according to the technique used by the author. The solid background shows the generated structure and the dotted exhibits the expected wave motion. .
Attention: The wave algorithm does not take into account the duration of the tool movements in time. To conduct a trade transaction, you need to confirm the signals used by your trading systems.
¡Los informes analíticos de InstaForex lo mantendrá bien informado de las tendencias del mercado! Al ser un cliente de InstaForex, se le proporciona una gran cantidad de servicios gratuitos para una operación eficiente.


