 Permanecer
Condiciones de negociación
Products
Herramientas


Wave picture of the chart D1:
An unfinished wave of cross-country scales of this scale is counting from September last year. The wave has reached its minimum design targets. At the same time, the proportions of the parts are not completely formed. There are no signals of an early change of direction, which allows one to expect the continuation of the current wave.
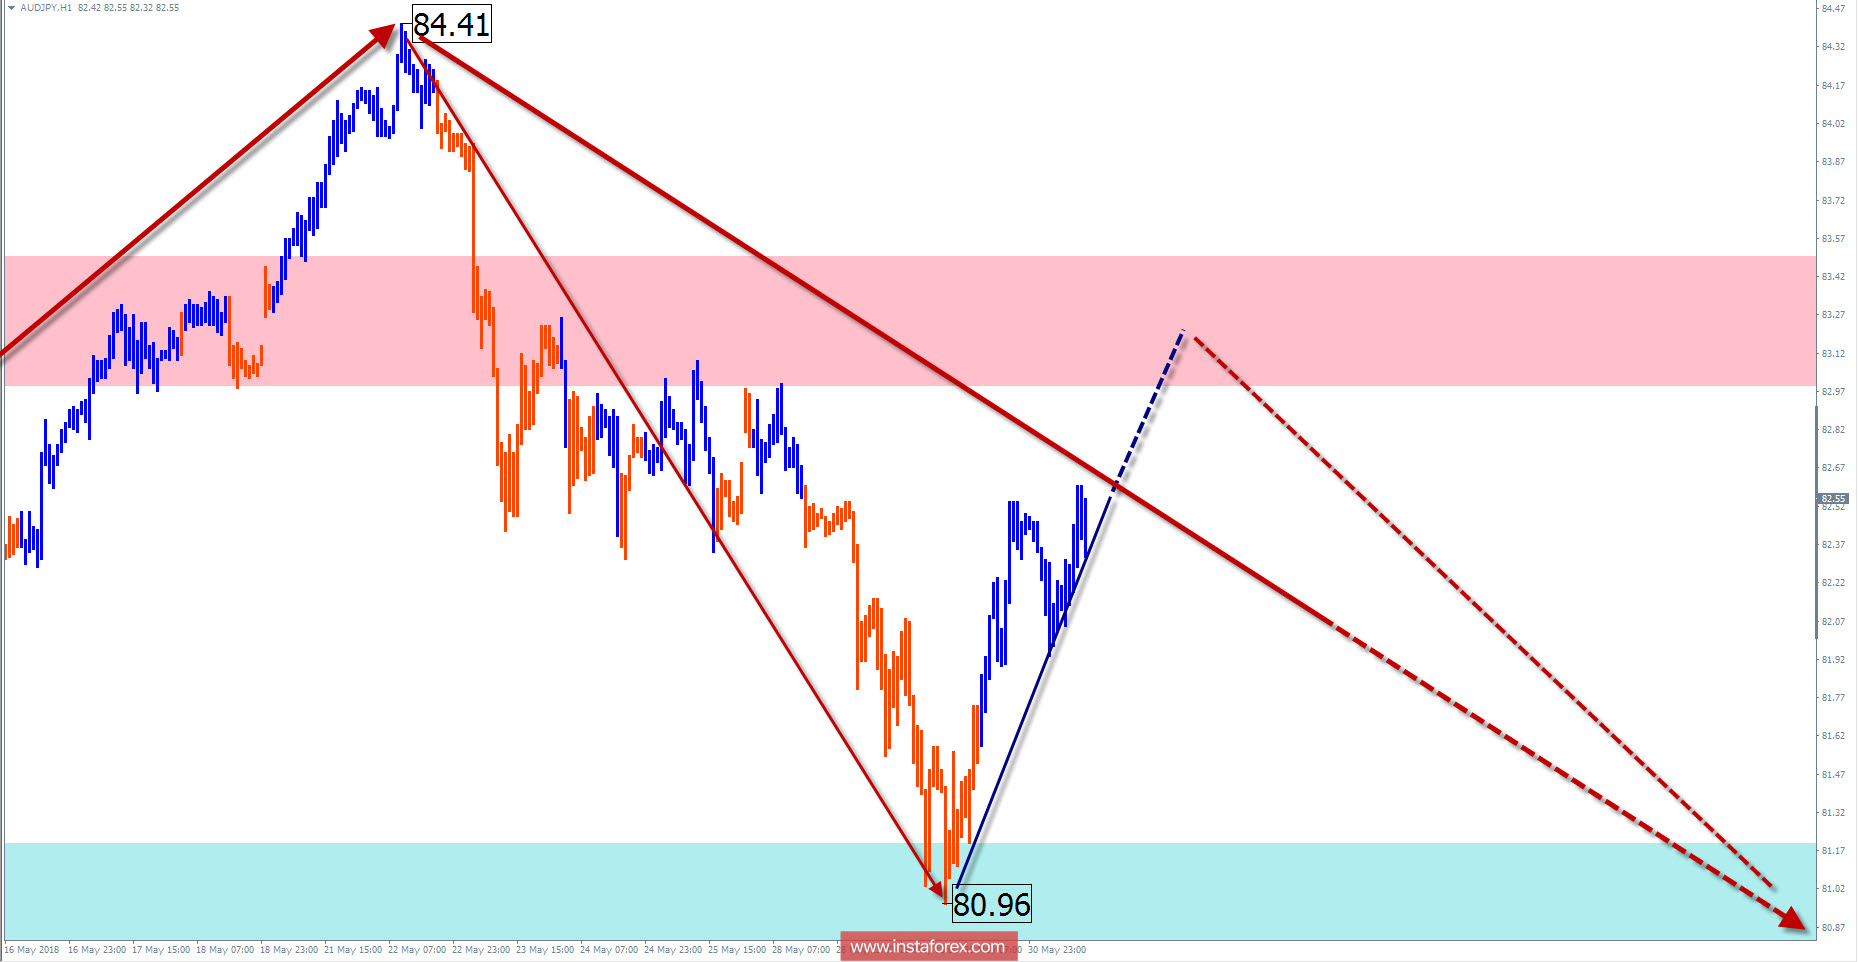
The wave pattern of the graph H1:
Towards the main direction of the trend since March 23, the chart has formed an ascending correction plane. The wave formed a price corridor in 3 price figures.
The wave pattern of the M15 chart:
The last, an unfinished wave plot for the bear market, started on May 22. Within the limits of the wave, the last few weeks have acquired the appearance of a wrong kind of correction. The nearest trading sessions are expected to be completed.
Recommended trading strategy:
For trading on time frames from H1 and higher trading signals are not formed. The short-term sales are possible for inter-day trading and intraday.
Resistance zones:
- 83.00 / 83.50
Support zones:
- 81.20 / 80.70
Explanations to the figures: Simplified wave analysis uses a simple waveform, in the form of a 3-part zigzag (ABC). At each TF the last incomplete wave is analyzed. Zones show the calculated areas with the greatest probability of a turn.
Arrows indicate the wave counting according to the technique used by the author. The solid background shows the generated structure, dotted - the expected wave motion.
Attention: The wave algorithm does not take into account the duration of the tool movements in time. To conduct a trade transaction, you need confirmation signals from your trading systems!
¡Los informes analíticos de InstaForex lo mantendrá bien informado de las tendencias del mercado! Al ser un cliente de InstaForex, se le proporciona una gran cantidad de servicios gratuitos para una operación eficiente.

