 Permanecer
Condiciones de negociación
Products
Herramientas


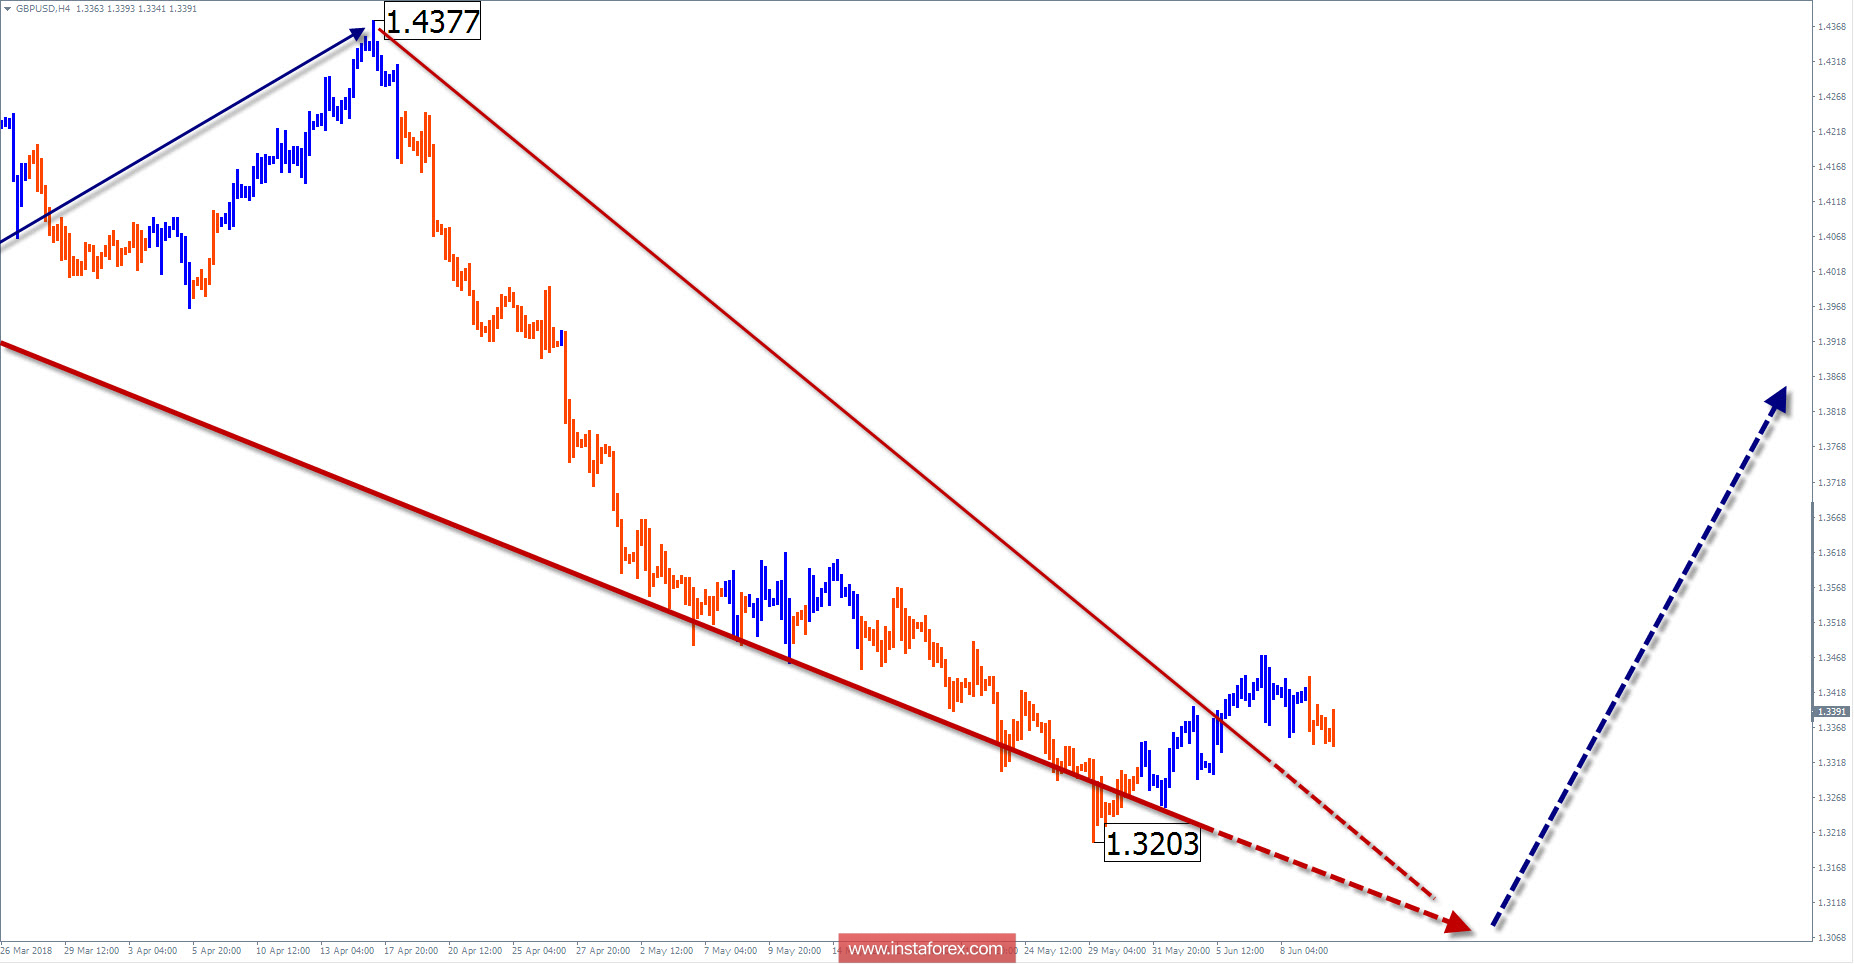
Wave picture of the chart H4:
The last major wave of January 25 is downward. The structure is fully formed, the proportions of all parts are achieved. The price of a potential reversal is reached at the price.
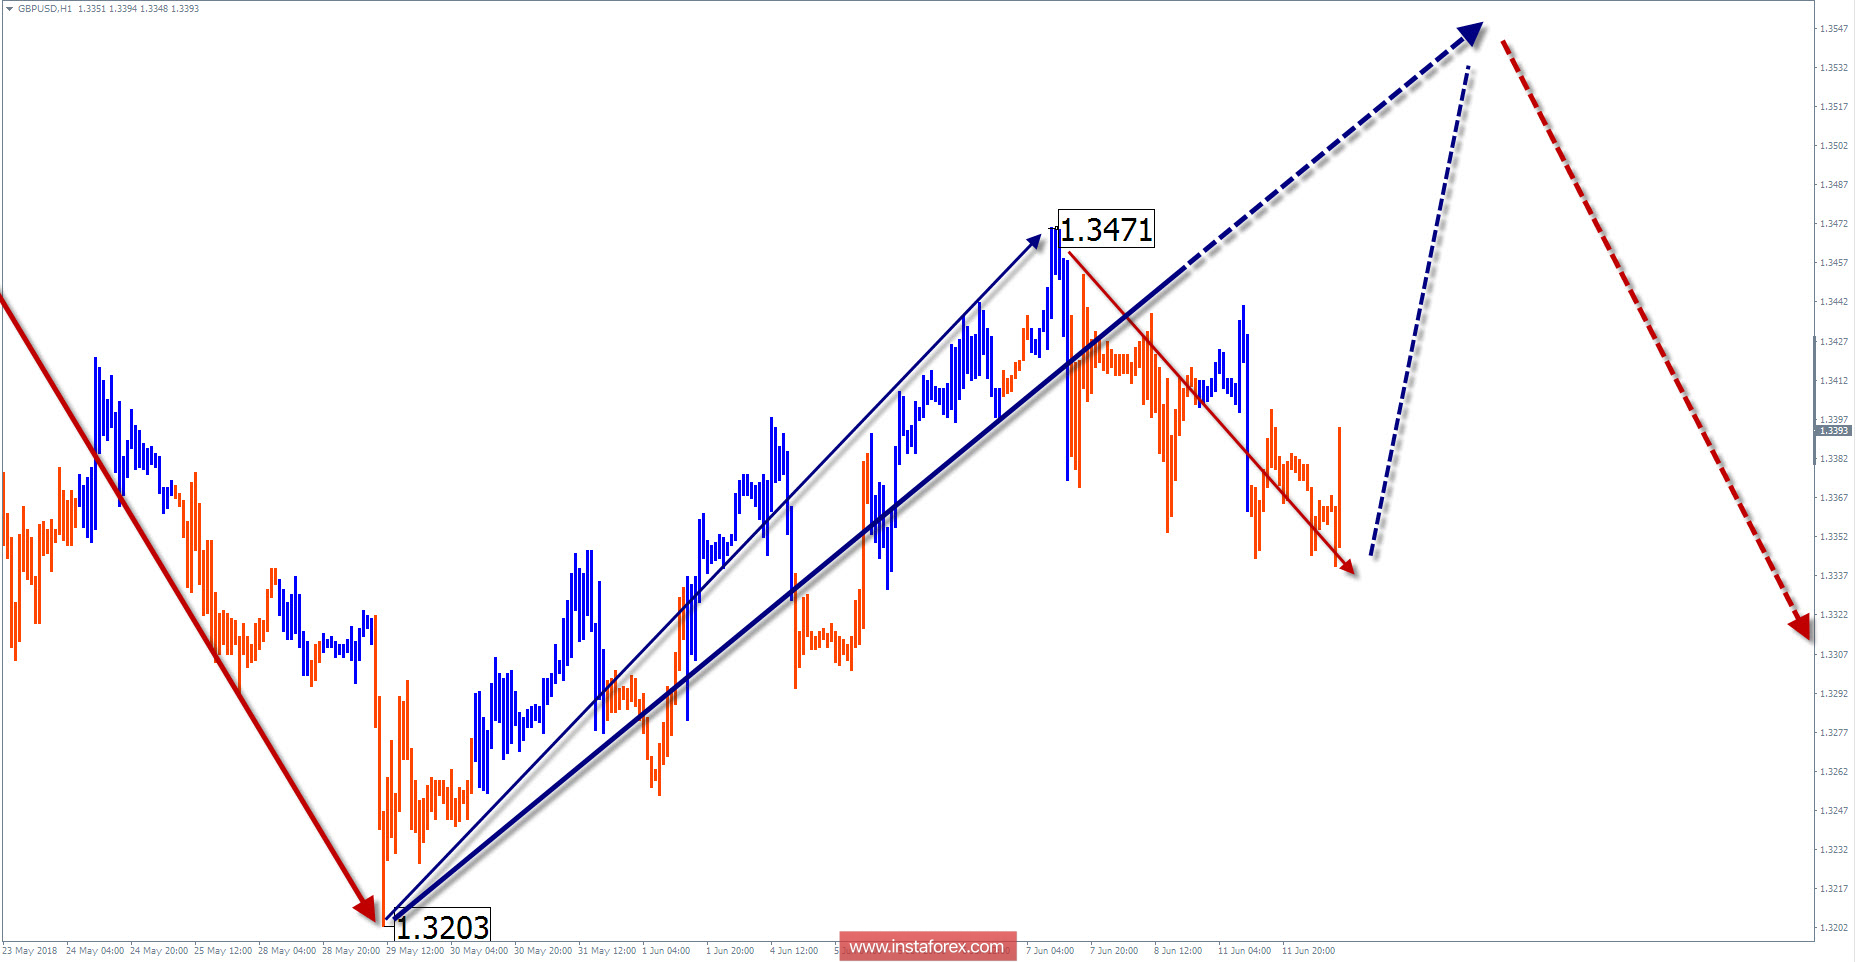
The wave pattern of the graph H1:
The wave of April 13 is bearish. The wave has reached the minimum elongation level.
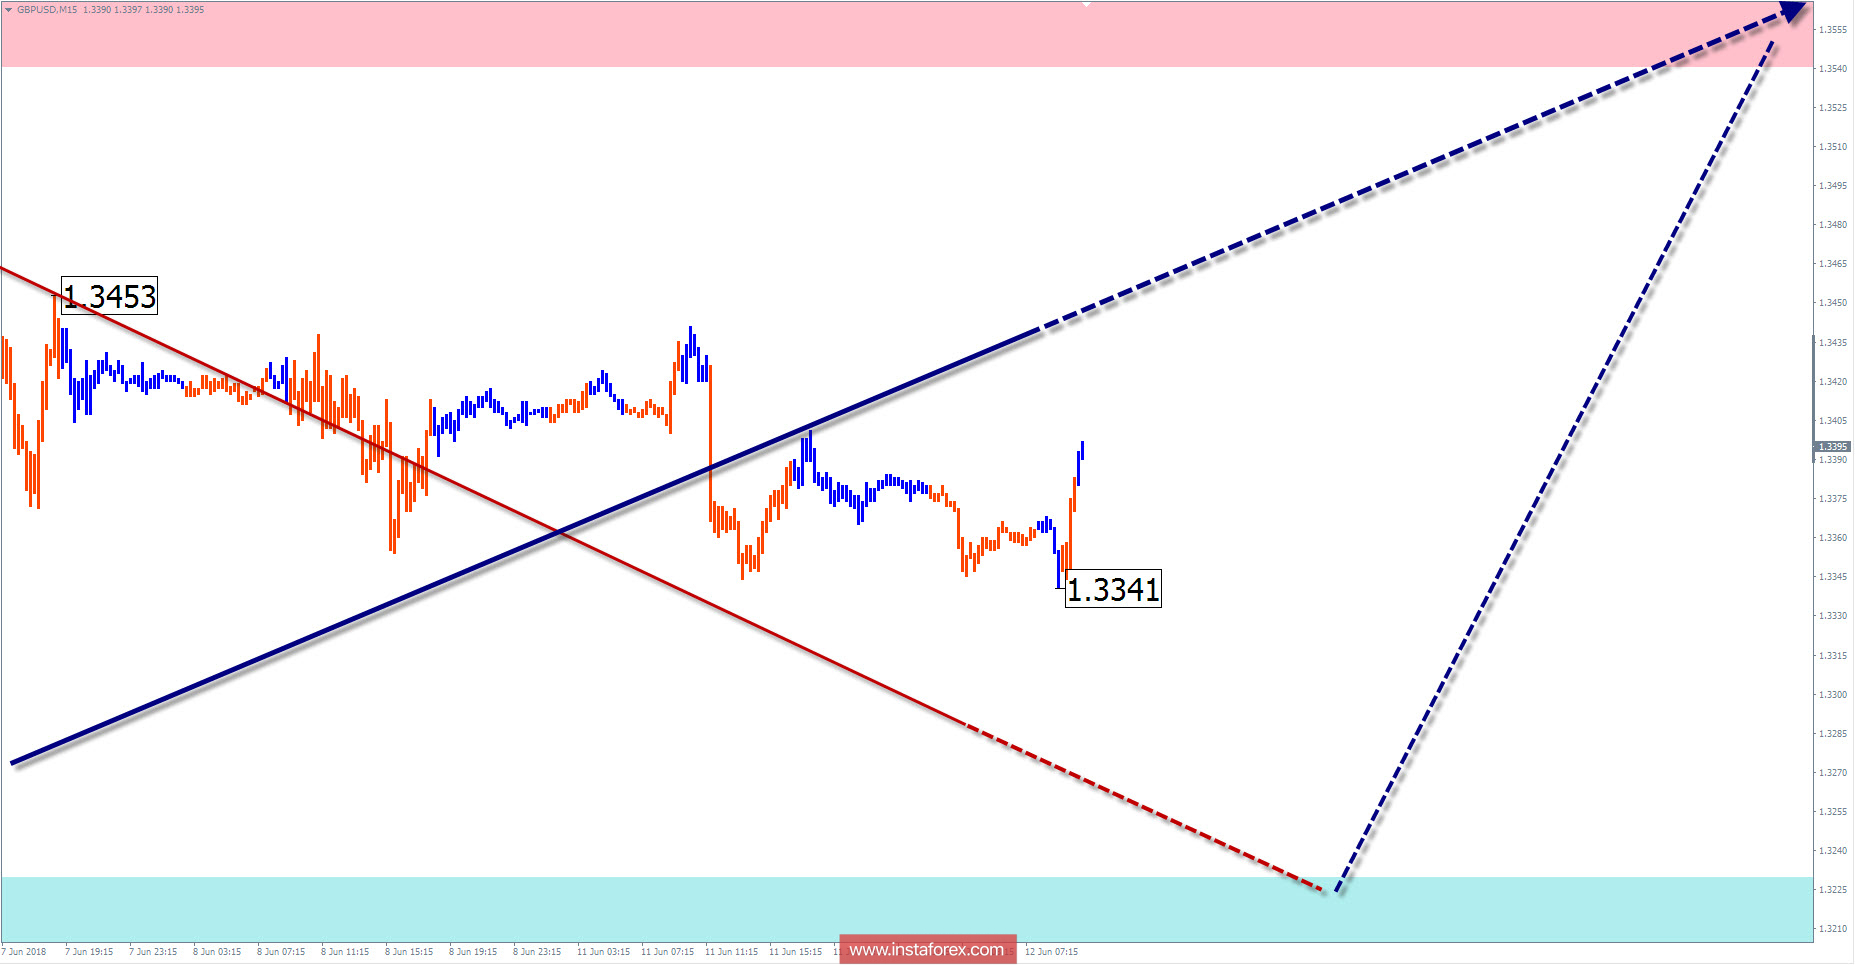
The wave pattern of the M15 chart:
Since May 29, the bullish wave forms a correction. The wave is not complete. Within its framework, a downward pullback is forming in recent days.
Recommended trading strategy:
For all types of trading strategies, sales are not recommended because of their limited capacity. Signals for purchase are better to lie in the area of settlement support.
Resistance zones:
- 1.3540 / 1.3590
Support zones:
- 1.3230 / 1.3180
Explanations to the figures: In a simplified wave analysis, waves consisting of 3 parts (A-B-C) are used. In the analysis, 3 main TFs participate, on each one the last incomplete wave is analyzed. Zones show the calculated areas with the greatest probability of a turn.
Arrows indicate the wave counting according to the technique used by the author. The solid background shows the generated structure, the dotted - the expected movements.
Attention: The wave algorithm does not take into account the duration of the tool movements in time. To conduct a trade transaction, you need confirmation signals from your trading systems!
¡Los informes analíticos de InstaForex lo mantendrá bien informado de las tendencias del mercado! Al ser un cliente de InstaForex, se le proporciona una gran cantidad de servicios gratuitos para una operación eficiente.


