 Permanecer
Condiciones de negociación
Products
Herramientas


The wave pattern of the H1 graph:
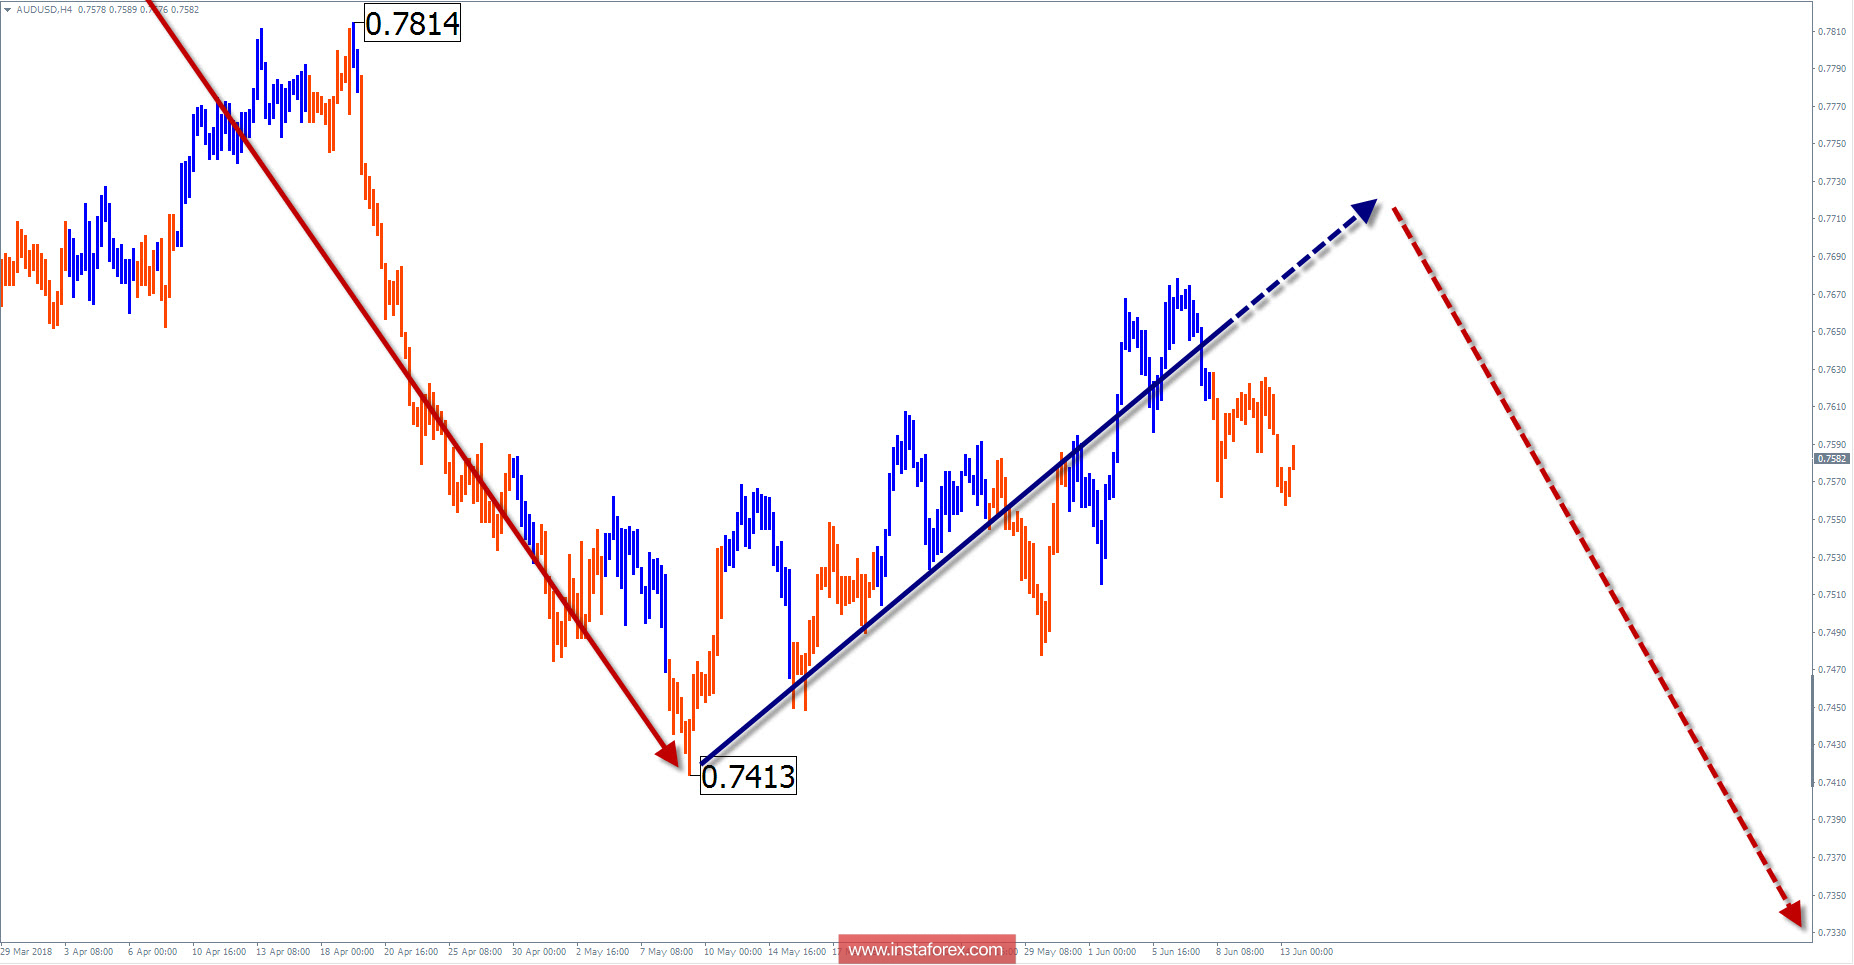
The bearish wave of the major "Aussie" since January 26 in a higher timeframe takes the place of the final part (C). A contemptible calculation allows you to wait for about 3 figures to the target zone.
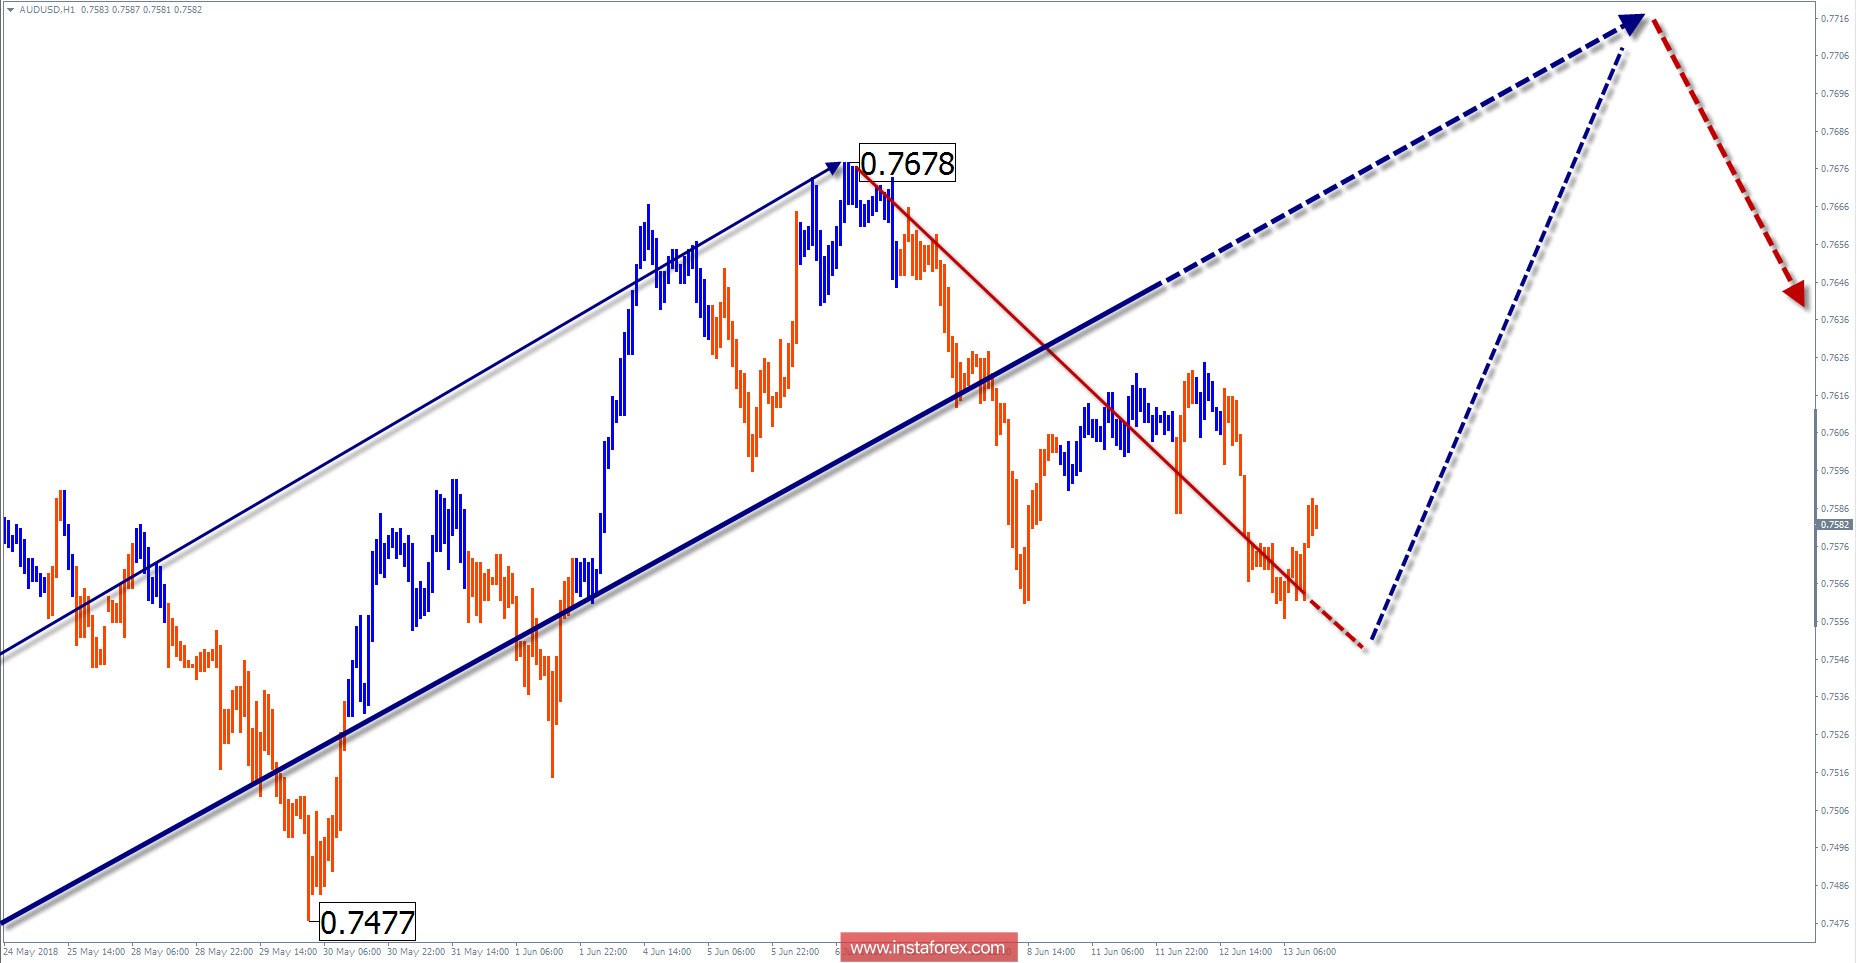
The wave pattern of the H1 graph:
Since May 9, quotations of the pair form a bullish wave. For the main trend, it forms a correction.
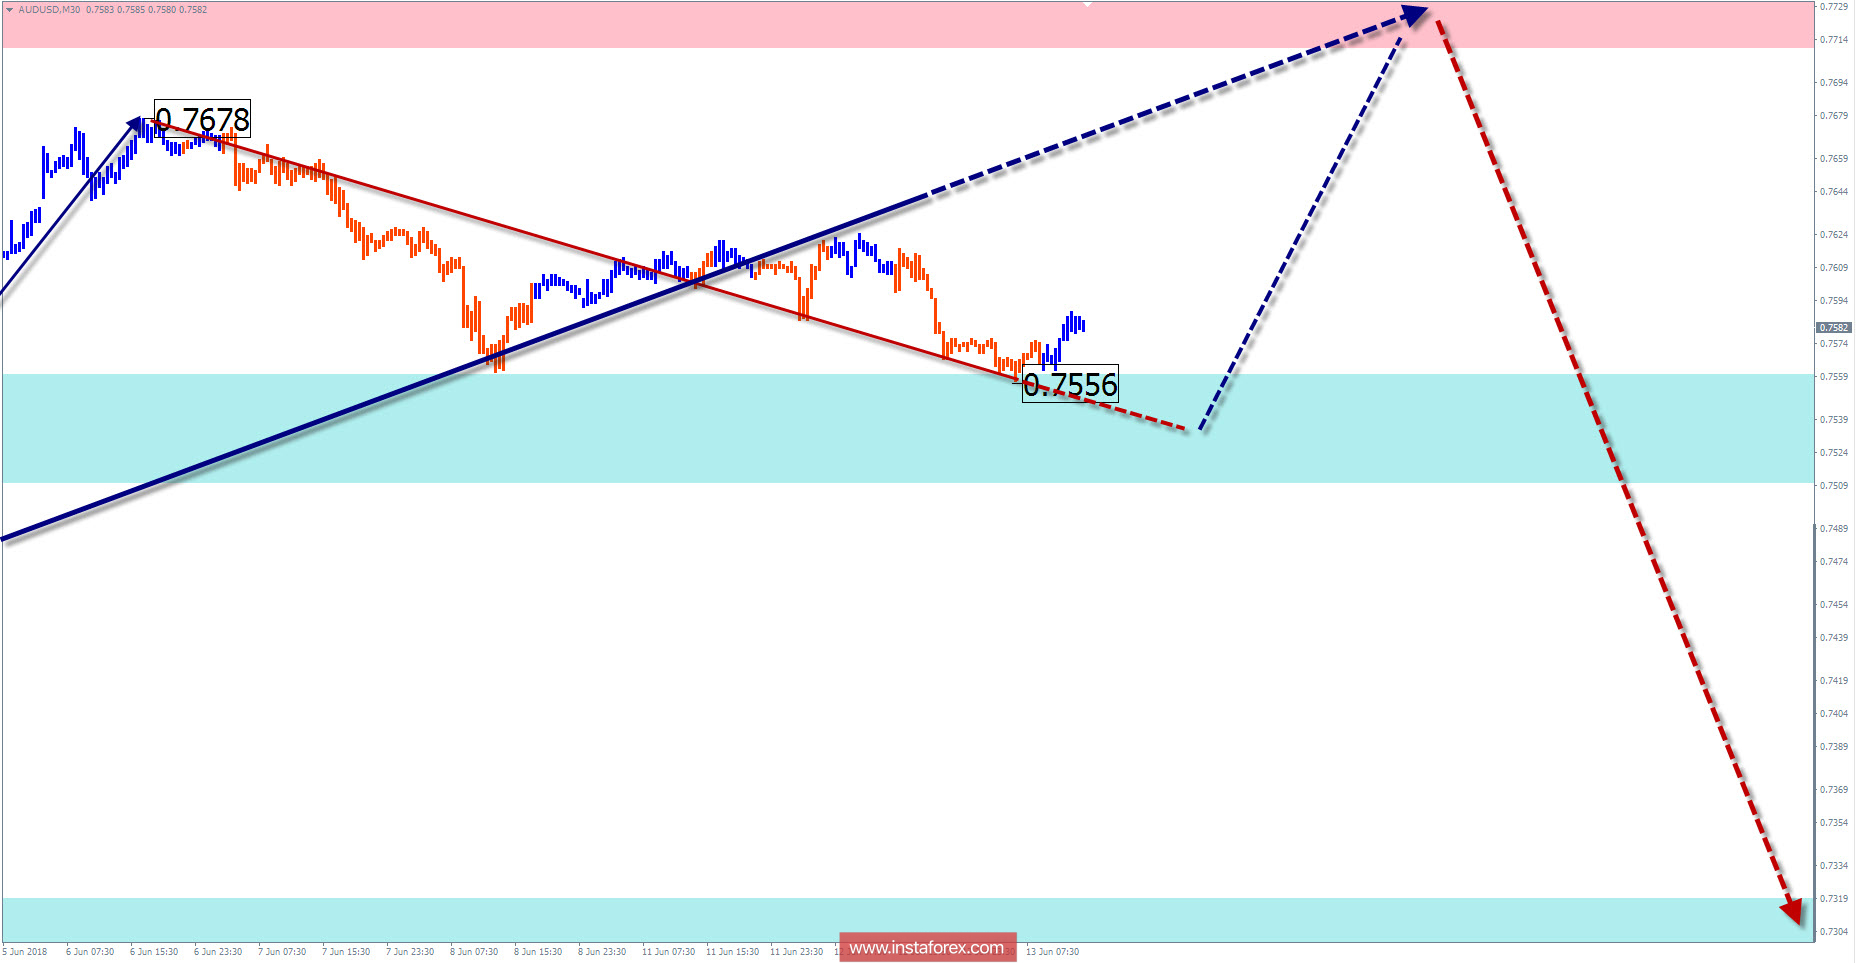
The wave pattern of the M15 chart:
The bearer section of June 6 corrects the first part of the zigzag wave (part AB).
Recommended trading strategy:
Next week, conditions for short-term purchases will appear only for inside day transactions. n the resistance zone, traders of larger timeframes are recommended to track sales signals.
Resistance zones:
- 0.7710 / 0.7760
Support zones:
- 0.7560 / 0.7510
- 0.7320 / 0.7270
Explanations to the figures:
A simplified wave analysis uses a simple waveform, in the form of a 3-part zigzag (ABC). The last incomplete wave for every timeframe is analyzed. Zones show the calculated areas with the greatest probability of a turn.
Arrows indicate the counting of wave according to the technique used by the author. The solid background shows the generated structure and the dotted exhibits the expected wave motion.
Attention: The wave algorithm does not take into account the duration of the tool movements in time. To conduct a trade transaction, you need to confirm the signals used by your trading systems.
¡Los informes analíticos de InstaForex lo mantendrá bien informado de las tendencias del mercado! Al ser un cliente de InstaForex, se le proporciona una gran cantidad de servicios gratuitos para una operación eficiente.

