 Permanecer
Condiciones de negociación
Products
Herramientas


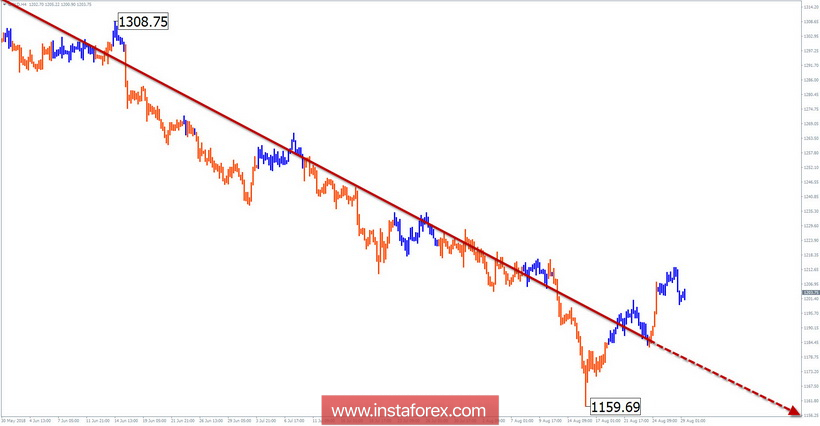
Wave picture of the H4 chart:
The prevailing trend on the gold chart moves the price downwards. The last and incomplete part from April 12 forms a wave of analyzed scale.
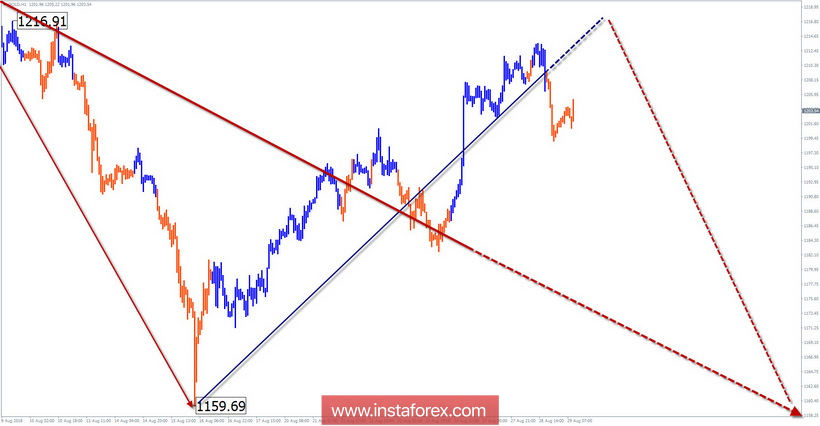
The wave pattern of the H1 graph:
Bear zone from June 14 forms the final part of a larger wave.
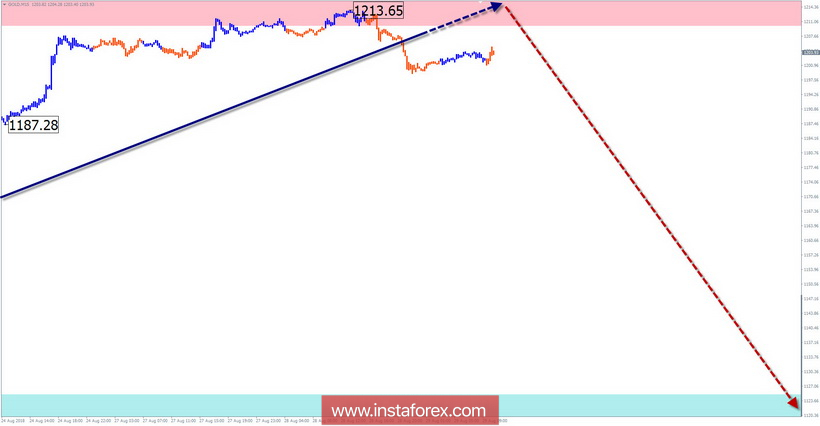
The wave pattern of the M15 chart:
Since August 16, the bullish wave corrects the last trend area of the higher TF. The price has reached the lower limit of the calculated completion zone.
Recommended trading strategy:
In the coming days, the gold exchange rate is expected to change. To open trading transactions, it is recommended to track the sell signals of the instrument.
Resistance zones:
- 1210.0 / 1220.0
Support zones:
- 1125.0 / 1115.0
Explanations to the figures: In a simplified wave analysis, waves consisting of 3 parts (A-B-C) are used. For analysis, 3 main TFs are used, on each one the last and incomplete wave is analyzed. Zones show the calculated areas with the highest probability of a turn.
Arrows indicate the wave counting according to the technique used by the author. The solid background shows the generated structure, the dotted - the expected movements.
Attention: The wave algorithm does not take into account the duration of the tool movements in time. To conduct a trade transaction, you need confirmation signals from your trading systems!
* The presented market analysis is informative and does not constitute a guide to the transaction.
¡Los informes analíticos de InstaForex lo mantendrá bien informado de las tendencias del mercado! Al ser un cliente de InstaForex, se le proporciona una gran cantidad de servicios gratuitos para una operación eficiente.

