 Permanecer
Condiciones de negociación
Products
Herramientas


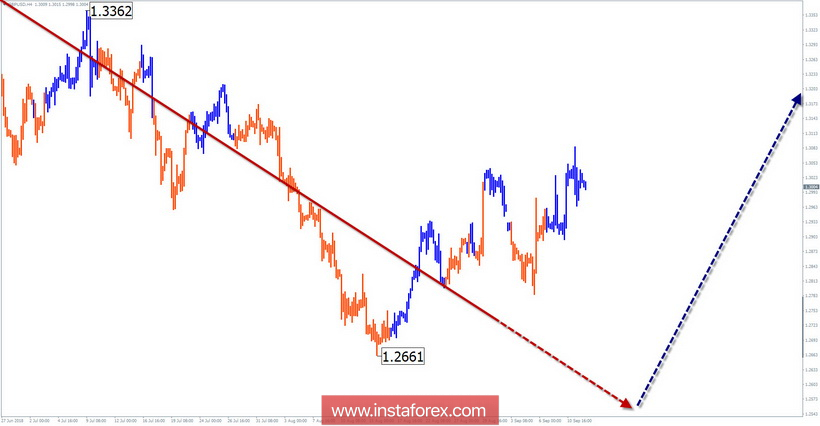
Wave picture of the H4 chart:
The bearish wave of April 17 sets the main trend direction of the small scale chart of the pair. The price has reached the upper limit of the large support zone.
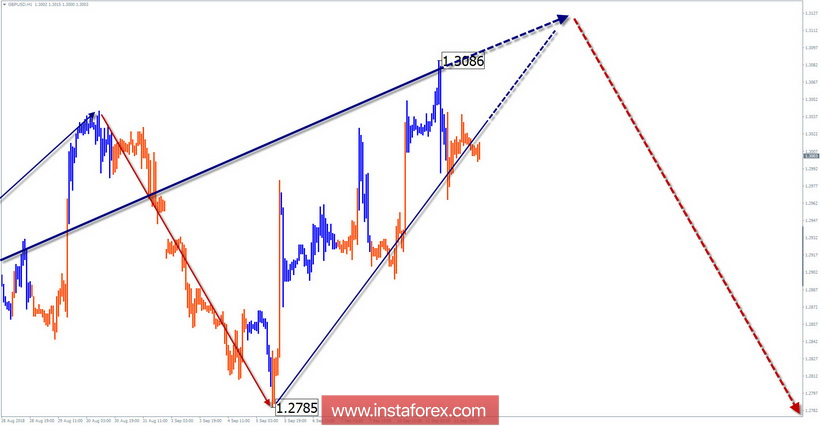
The wave pattern of the H1 graph:
Since August 15, a zigzag wave is forming upward. In the wave of higher timeframe, it is a correction.
The wave pattern of the M15 chart:
The ascending segment of September 5 took the place of the final part (C) in the hourly wave. The price is approaching the target traffic zone.
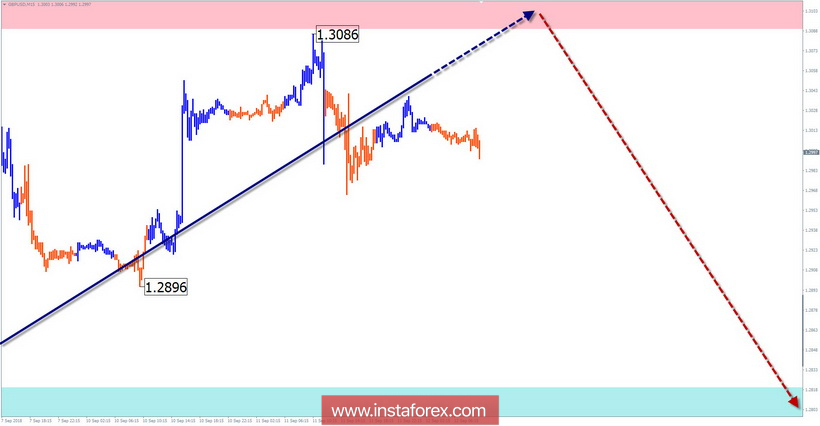
Recommended trading strategy:
The EUR/USD pair movement of the vector is expected to change next week. In the area of design resistance, it is proposed to monitor the signals of the sale of the instrument.
Resistance zones:
- 1.3090 / 1.3140
Support zones:
- 1.2820 / 1.2770
Explanations to the figures:
A simplified wave analysis uses a simple waveform, in the form of a 3-part zigzag (ABC). The last incomplete wave for every time frame is analyzed. Zones show the calculated areas with the greatest probability of a turn.
Arrows indicate the counting of wave according to the technique used by the author. The solid background shows the generated structure and the dotted exhibits the expected wave motion.
Attention: The wave algorithm does not take into account the duration of the tool movements in time. To conduct a trade transaction, you need to confirm the signals used by your trading systems.
¡Los informes analíticos de InstaForex lo mantendrá bien informado de las tendencias del mercado! Al ser un cliente de InstaForex, se le proporciona una gran cantidad de servicios gratuitos para una operación eficiente.

