 Permanecer
Condiciones de negociación
Products
Herramientas


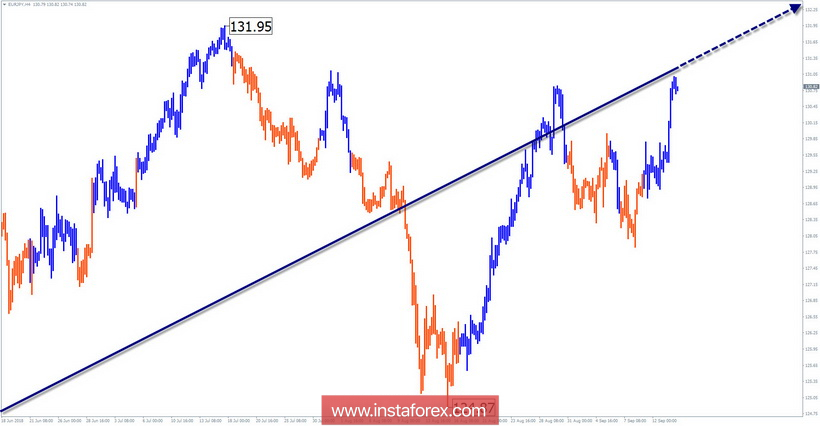
Wave picture of the chart H4:
The direction of the trend is set by the upward wave of May 29. A distinct zigzag (A-B-C) can be traced in the structure.
The wave pattern of the graph H1:
The bullish wave of August 13 is approaching a powerful potential reversal zone. The structure of the movement is not complete, but it allows us to wait for a rollback in the near future.

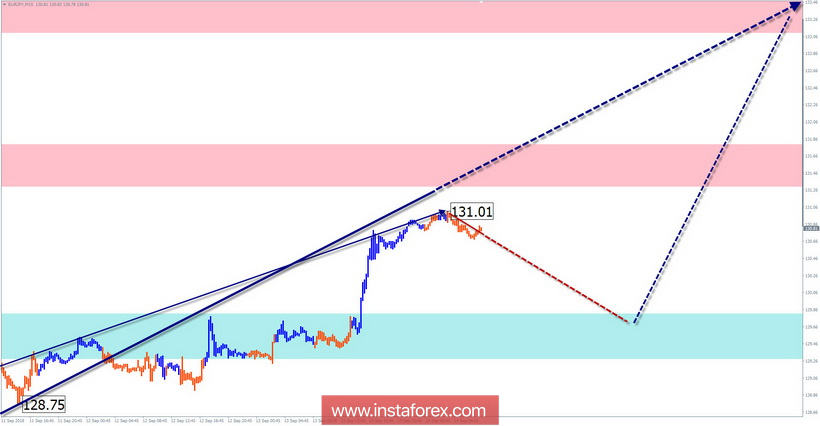
The wave pattern of the M15 chart:
Since September 10, the price forms an ascending segment, occupying the place of the final part (C) in a larger model. Correction is expected in the coming days.
Recommended trading strategy:
Sales of the pair at price retracements are high-risk. For all trading styles at the end of all counter moves, prices are recommended to track buy signals of the pair.
Resistance zones:
- 133.10 / 133.60
- 131.30 / 131.80
Support zones:
- 129.80 / 129.30
Explanations to the figures: In a simplified wave analysis, waves consisting of 3 parts (A-B-C) are used. For analysis, 3 main TFs are used, on each one the last, incomplete wave is analyzed. Zones show the calculated areas with the greatest probability of a turn.
Arrows indicate the wave counting according to the technique used by the author. The solid background shows the generated structure, the dotted - the expected movements.
Attention: The wave algorithm does not take into account the duration of the tool movements in time. To conduct a trade transaction, you need confirmation signals from your trading systems!
¡Los informes analíticos de InstaForex lo mantendrá bien informado de las tendencias del mercado! Al ser un cliente de InstaForex, se le proporciona una gran cantidad de servicios gratuitos para una operación eficiente.


