 Permanecer
Condiciones de negociación
Products
Herramientas


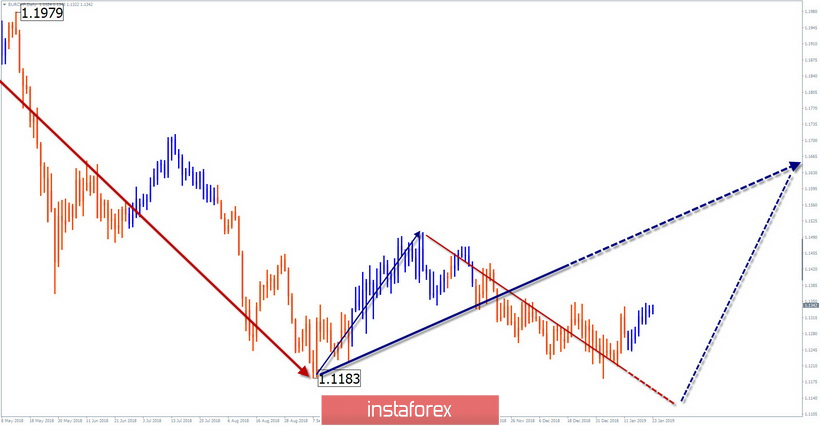
Large scale graphics:
The latest current wave design of the cross is ascending, starting from September 10th. It is formed along a powerful support zone. The structure in recent months takes the form of the middle part (B), which has a high chance to break through the level of the beginning of the entire wave.
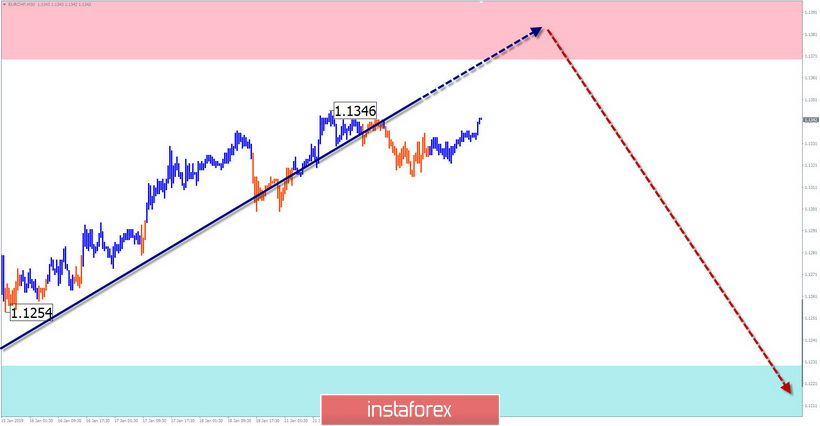
Medium scale graphics:
As part of a larger model, a correction has been formed on the graph since December 11. The wave structure looks complete.
Small scale graphics:
The descending segment of January 11 can be considered as the beginning of the next part of the main trend wave with high probability. The wave has a reversal potential after the completion of the current rollback (B) followed by a price reduction (C).
Forecast and recommendations:
The conditions for a change in the short -term trend are formed on the pair chart, which so far excludes lengthy transactions. For supporters of the inter-day style, there is an opportunity to make short-term sales.
Resistance zones:
- 1.1370 / 1.1420
Support areas:
- 1.1230 / 1.1180
Explanations to the figures: The simplified wave analysis uses waves consisting of 3 parts (A – B – C). For analysis, 3 consecutive graphs are used. Each of them analyzes the last, incomplete wave. Zones show calculated areas with the highest probability of reversal. On the other hand, the arrows indicate the wave marking by the method used by the author. While the solid background shows the formed structure, the dotted - the expected movement.
Attention: The wave algorithm does not take into account the duration of tool movements over time. To conduct a trade transaction, you need confirmation signals from the trading systems you use.
¡Los informes analíticos de InstaForex lo mantendrá bien informado de las tendencias del mercado! Al ser un cliente de InstaForex, se le proporciona una gran cantidad de servicios gratuitos para una operación eficiente.


