 Permanecer
Condiciones de negociación
Products
Herramientas


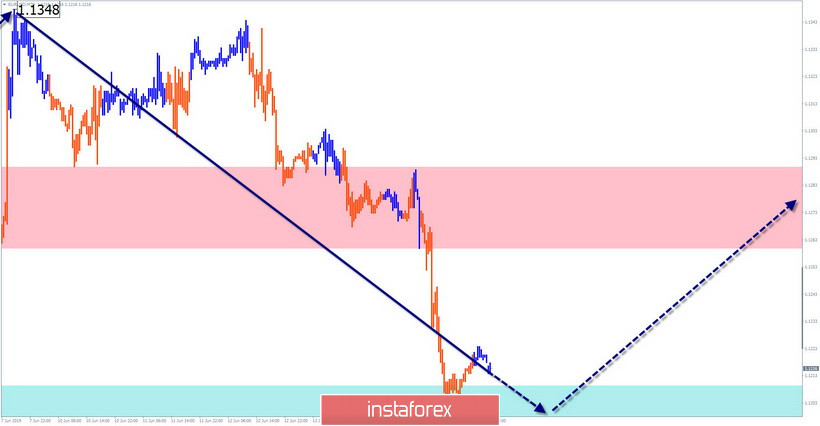
EUR/USD
The direction of price fluctuations in the euro in recent weeks sets the algorithm of the upward wave of May 23. Within the framework of this wave, a counter-movement is formed from June 7 downwards, the potential of which does not exceed the correction framework to date. The price reached the borders of potentially divergent zones of the large timeframes, but the reversal signal on the chart is not observed.
Forecast:
Today, the price movement is expected on the chart of the pair mainly in the lateral plane, between the nearest counter zones. At the next session, a repeated attempt to put pressure on the support zone is possible. The change of the intersessional course can be expected towards the end of the day.
Recommendations:
Today, trading in the euro market can be risky. When making purchases, it is more reasonable to reduce the lot size as much as possible. In the area of the resistance zone, it is recommended to track the reversal signals to find the point of sale of the pair.
Resistance zone:
- 1.1260/1.1290
Support zone:
- 1.1210/1.1180
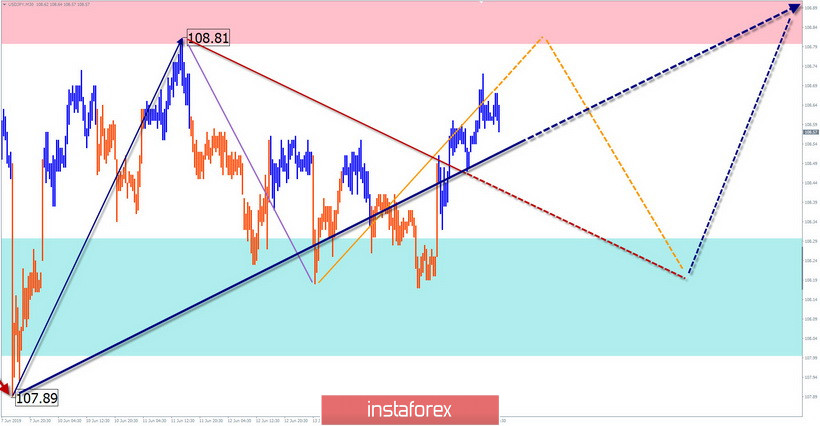
USD/JPY
Since the beginning of June, the upward wave continues to form on the Japanese yen chart, correcting a portion of the previous trend. The wave structure is not complete. The preliminary potential of the move is estimated at 2 price figures from the current rate.
Forecast:
Today, there is a high probability of the formation of an intermediate correctional movement. The daily range of oscillations is limited by the counter-calculated zones. The downward vector of price movement is more likely in the afternoon.
Recommendations:
In the market, "pipsing" transactions are more preferable, according to the described sequence. For a full-fledged trade, it is recommended to wait for the completion of the upcoming rollback and look for signals to enter long positions.
Resistance zone:
- 108.80/109.10
Support zone:
- 108.30/108.00
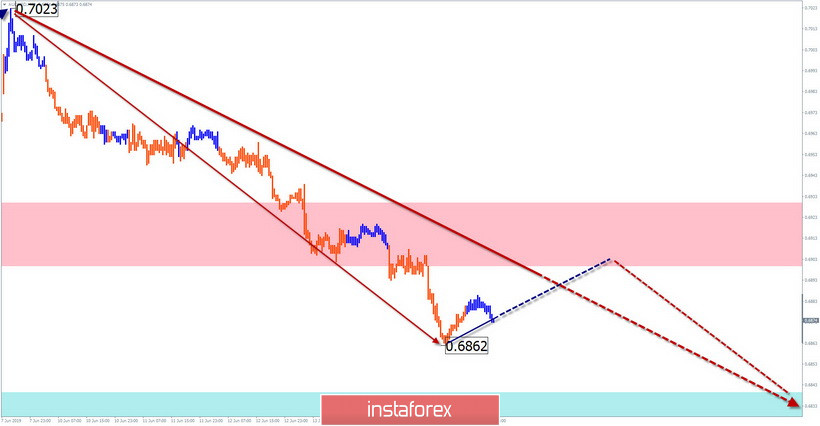
AUD/USD
The main direction of the Australian dollar major since the end of January is set by the bearish trend. The wave of April 17 completes the design. Within its framework, the first two parts (A+B) are formed. The final part (C) started on June 7.
Forecast:
Today in the first half of the day, the upward pullback that began at the end of last week is expected to develop. The size of the lift is limited by the resistance zone. By the end of the day, the probability of returning to the main course of movement increases.
Recommendations:
When purchasing today, it will be the right to reduce the lot size due to the high probability of counter movements. When the price reaches the resistance zone, it is recommended to start tracking the sell signals of the instrument.
Resistance zone:
- 0.6900/0.6930
Support zone:
- 0.6840/0.6810
Explanations to the figures: Waves in the simplified wave analysis consist of 3 parts (A-B-C). The last unfinished wave is analyzed. Zones show areas with the highest probability of reversal. The arrows indicate the wave marking according to the method used by the author, the solid background is the formed structure, the dotted ones are the expected movements.
Note: The wave algorithm does not take into account the duration of tool movements over time.
¡Los informes analíticos de InstaForex lo mantendrá bien informado de las tendencias del mercado! Al ser un cliente de InstaForex, se le proporciona una gran cantidad de servicios gratuitos para una operación eficiente.


