 Permanecer
Condiciones de negociación
Products
Herramientas


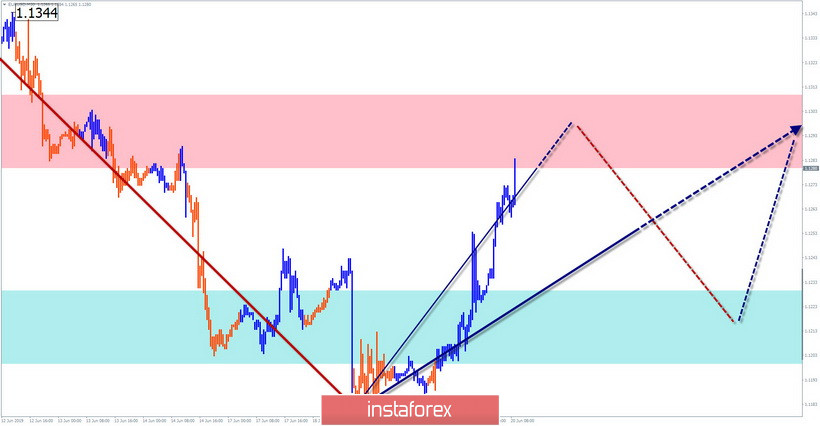
EUR / USD pair
All price fluctuations of the euro on the chart fit into the algorithm formed from the bullish wave on May 23. The structure traces the first 2 parts (A + B), while the completion B cannot be confirmed yet. The bullish wave level started on June 18 does not exceed the level of correction of the previous segment.
Forecast:
At the next trading sessions today, the probability of forming a correction is high. It can take the form of flat outset with acceleration in the final phase. Before the start of a decline, a short puncture of the upper resistance limit is possible.
Recommendations:
Euro purchases can be risky today. Until confirmation of a change in the exchange rate, sales remain in priority. It is proposed to track the reversal signals in the area of the resistance zone for making deals for sale.
Resistance zones:
- 1.1280 / 1.1310
Support areas:
- 1.1230 / 1.1200
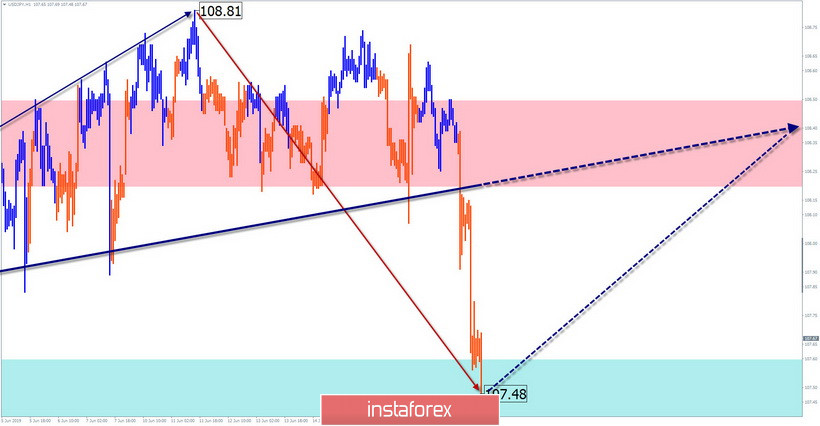
USD / JPY pair
The bullish wave develops on the chart of the major Japanese currency since June 3. Its structure has the wrong form and complex shape and lacks the final part (C). With its movements in the flat, the wave gained a high wave level, allowing it to claim correction of the entire wave of the previous trend. The price has reached the upper level of a powerful zone of potential reversal.
Forecast:
Over the coming sessions, the end of the current decline and the beginning of the price increase of the pair is expected. A predominantly flat character of movements is expected, with increasing volatility in the final part. The border of the expected daily volatility is demonstrated by the resistance zone.
Recommendations:
The sales of the pair are unpromising today. It is recommended to track the signals of your vehicle on the purchase tool.
Resistance zones:
- 108.20 / 108.50
Support areas:
- 107.60 / 107.30
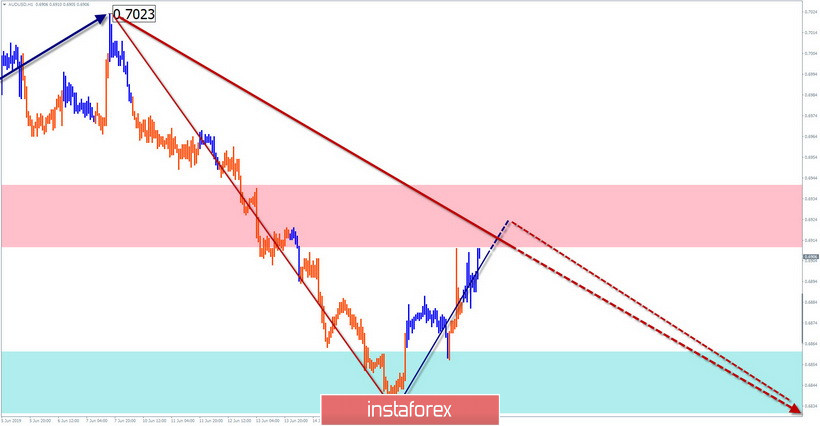
AUD / USD pair
The direction of the "Aussie" short-term trend from the beginning of the current year is set by a bearish wave. As part of the final section of June 7, a counter correction is developing in the last 3 days. The structure of this wave looks complete, reaching the price of the lower boundary of the potential reversal zone.
Forecast:
Today, it is expected to complete the entire current bull wave, as well as, the formation of a reversal and the beginning of the decline. A breakthrough of the upper boundary of the resistance zone when changing course is possible, but unlikely.
Recommendations:
The potential for purchases of the pair is exhausted. Intraday traders are advised to track signals to sell the instrument. For longer transactions, you need to wait for clearer conditions in the market of the pair.
Resistance zones:
- 0.6910 / 0.6940
Support areas:
- 0.6860 / 0.6830
Explanations to the figures: The simplified wave analysis uses waves consisting of 3 parts (A – B – C). Each of these analyzes the last incomplete wave. Zones show calculated areas with the highest probability of reversal. The arrows indicate the wave marking by the method used by the author. The solid background shows the formed structure and the dotted exhibits the expected movement.
Note: The wave algorithm does not take into account the duration of tool movements over time.
¡Los informes analíticos de InstaForex lo mantendrá bien informado de las tendencias del mercado! Al ser un cliente de InstaForex, se le proporciona una gran cantidad de servicios gratuitos para una operación eficiente.

