 Permanecer
Condiciones de negociación
Products
Herramientas


EUR/USD
Since June 25, a downward wave model has been developing on the chart of the European currency. In the last 2 weeks, within its framework, a correction is formed in the flat corridor, which has a distinct zigzag shape. The wave structure looks complete. The price supports the potential reversal zone.
Forecast:
In the next day, the full completion of the upward course of the movement is expected. The formation of a reversal is most likely in the area of resistance, while the short-term puncture of the upper boundary of the zone is not excluded. The beginning of the price decline can be shifted in time to the next trading day.
Recommendations:
When buying euros, one should take into account the limited growth potential. In the area of the calculated resistance, it is recommended to track the signals of your vehicle for the sale of the instrument.
Resistance zone:
- 1.1280/1.1310
Support zone:
- 1.1230/1.1200

GBP/USD
The high wave level of the upward wave, which started on July 17 on the chart of the British pound, makes it possible to classify it as the beginning of a new upward short-term trend. After breaking a powerful resistance level, the price rolls back down.
Forecast:
At the next trading sessions, the completion of the price reduction, reversal and price rise are expected. The upper limit of daily volatility is limited by the resistance zone. It is likely that after contact with it, the price will begin to form a full correction.
Recommendations:
Sales of the pound in the first half of the day are unpromising. It is recommended to track the buy signals. Given the limited price move up, do not leave these transactions unattended. By the end of the day, you should be ready for the appearance of the instrument sale signals.
Resistance zone:
- 1.2570/1.2600
Support zone:
- 1.2510/1.2480
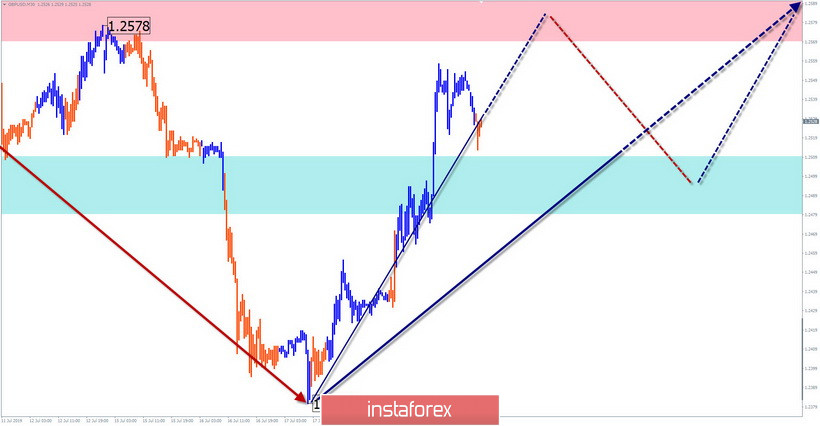
Explanations to the figures: Waves in the simplified wave analysis consist of 3 parts (A-B-C). The last unfinished wave is analyzed. Zones show areas with the highest probability of reversal. The arrows indicate the wave marking according to the method used by the author, the solid background is the formed structure, the dotted ones are the expected movements.
Note: The wave algorithm does not take into account the duration of tool movements over time.
¡Los informes analíticos de InstaForex lo mantendrá bien informado de las tendencias del mercado! Al ser un cliente de InstaForex, se le proporciona una gran cantidad de servicios gratuitos para una operación eficiente.


