 Permanecer
Condiciones de negociación
Products
Herramientas


Last week, the pair tested the historical support level of 1.2030 (blue bold line), went up and reached the resistance line of 1.2352 (red bold line). The pair is clamped in a very narrow price range, and the breakdown of the downward channel will be strong. It remains to determine the direction of the breakdown. Most likely, an upward movement is possible this week.
Trend analysis.
This week, the price will move up from the first target resistance line – 1.2305 (red bold line). In the case of a breakdown, further up to the pullback level of 14.6% - 1.2358 (yellow dashed line).
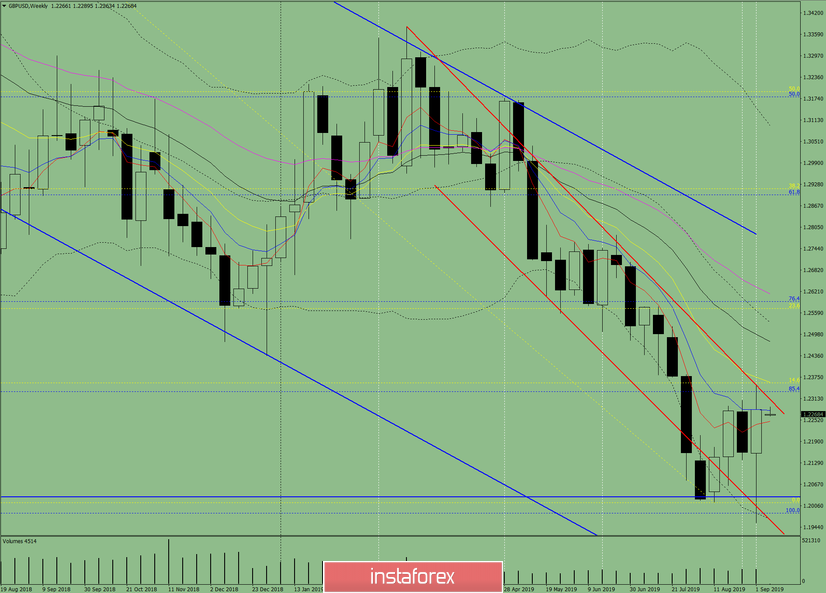
Fig. 1 (weekly schedule).
Comprehensive analysis:
- Indicator analysis – up;
- Fibonacci levels – up;
- Volumes – down;
- Candlestick analysis – up;
- Trend analysis – down;
- Bollinger Bands – up;
- Monthly chart – up.
The conclusion of the comprehensive analysis is an upward movement.
The overall result of calculating the candle of the GBP/USD currency pair according to the weekly chart: the price of the week is likely to have an upward trend with the absence of the first lower shadow of the weekly white candlestick (Monday – up) and the presence of the second upper shadow (Friday – down).
This week, the price will move up from the first target of 1.2305 – the resistance line (red bold line).
¡Los informes analíticos de InstaForex lo mantendrá bien informado de las tendencias del mercado! Al ser un cliente de InstaForex, se le proporciona una gran cantidad de servicios gratuitos para una operación eficiente.


