 Permanecer
Condiciones de negociación
Products
Herramientas


Trend analysis (Fig. 1).
On Friday, the price after breaking through the pullback level of 38.2% (1.2502 - the red dotted line) may continue to move up to the target of 1.2670 - the pullback level of 50% (red dashed line). The next level may occur pullbacks to bottom: 1.2560 (the upper fractal), 1.2649 (the upper boundary of the Bollinger bands).
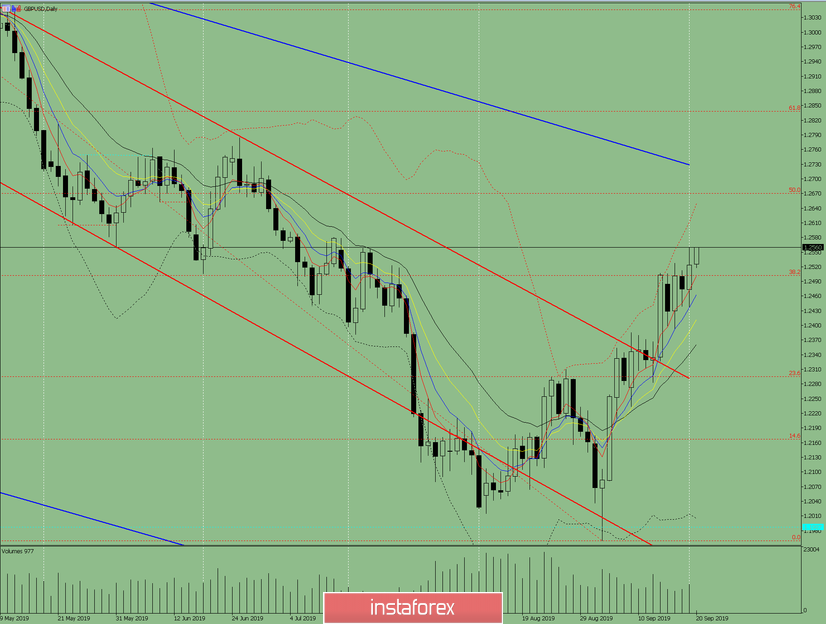
Fig. 1 (daily chart).
Comprehensive analysis:
- indicator analysis - up;
- Fibonacci levels - up;
- volumes - up;
- candlestick analysis - up;
- trend analysis - up;
- Bollinger Lines - up;
- weekly schedule - up.
General conclusion:
On Friday, the price will continue to move up.
An unlikely scenario is a downward movement, with the first target of 1.2438 - a lower fractal.
¡Los informes analíticos de InstaForex lo mantendrá bien informado de las tendencias del mercado! Al ser un cliente de InstaForex, se le proporciona una gran cantidad de servicios gratuitos para una operación eficiente.

