 Permanecer
Condiciones de negociación
Products
Herramientas


Trend analysis (Fig. 1).
On Thursday, the market may attempt to break through a cloud consisting of a pullback level of 50.0% - 1,0996 (blue dashed line) and 21 average EMA - 1.0971 (black thin line) once again. And if successful, rush to goal 1.1031 - the resistance line (blue bold line).
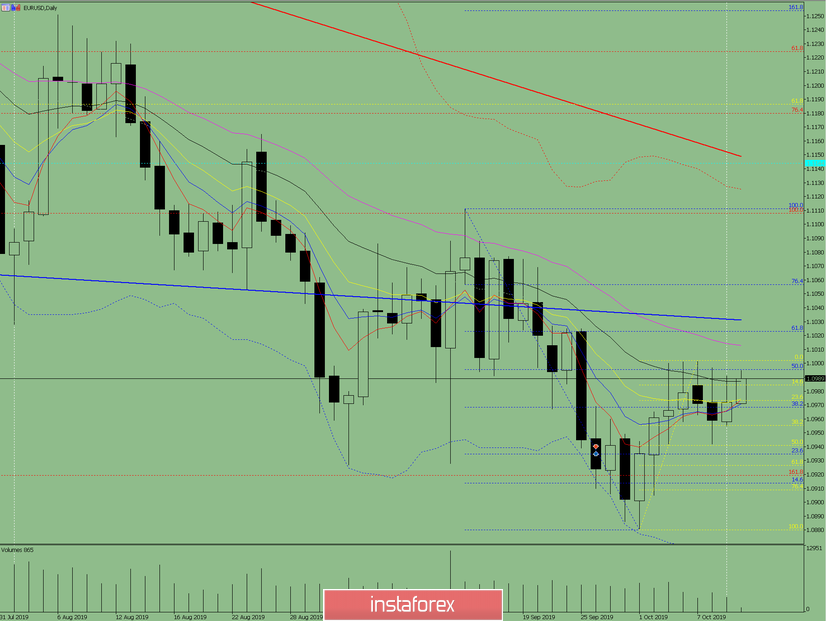
Fig. 1 (daily chart).
Comprehensive analysis:
- indicator analysis - up;
- Fibonacci levels - up;
- volumes - up;
- candlestick analysis - neutral;
- trend analysis - up;
- Bollinger Lines - up;
- weekly schedule - up.
General conclusion:
On Thursday, upward movement is possible from the level of 1.0996, the upper target 1.1031 is the resistance line (blue bold line).
An unlikely scenario - from the level of 1.0996, a downward movement with the target of 1.0942 is a lower fractal.
¡Los informes analíticos de InstaForex lo mantendrá bien informado de las tendencias del mercado! Al ser un cliente de InstaForex, se le proporciona una gran cantidad de servicios gratuitos para una operación eficiente.


