 Permanecer
Condiciones de negociación
Products
Herramientas


Trend analysis (Fig. 1).
On Monday, the price may continue to move down with the first target 1.1041 which is the lower fractal. If this level is reached, the continuation of work down with the target 1.1026 is the support line presented in a red bold line.
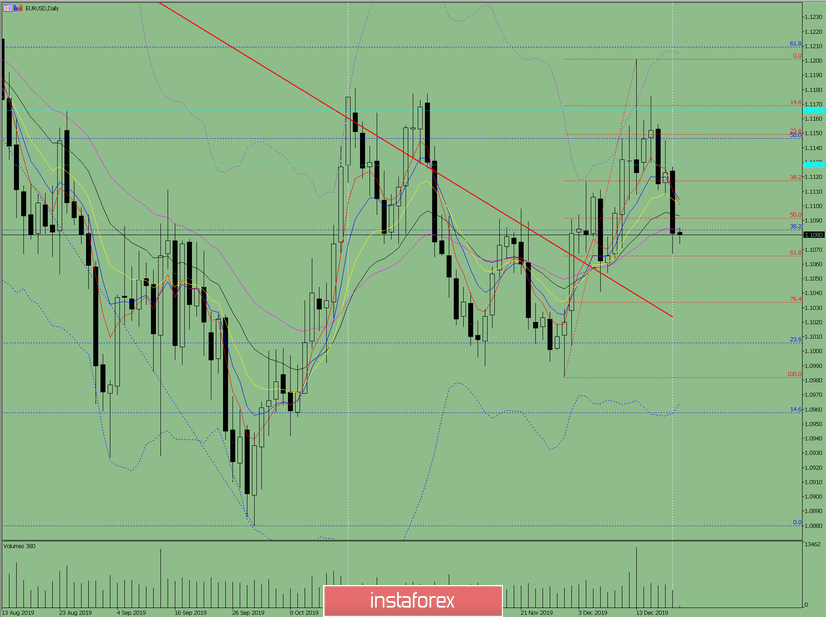
Fig. 1 (daily chart).
Comprehensive analysis:
- Indicator analysis - down;
- Fibonacci levels - down;
- Volumes - down;
- Candlestick analysis - down;
- Trend analysis - up;
- Bollinger Lines - down;
- Weekly schedule - up.
General conclusion:
On Monday, a downward trend is possible.
An unlikely scenario is possible, where, from a pullback level of 61.8% which is equivalent to 1.1066 presented in a red dashed line, the price will go up to the upper target of 1.1128 which is the historical resistance level presented in a blue dashed line.
¡Los informes analíticos de InstaForex lo mantendrá bien informado de las tendencias del mercado! Al ser un cliente de InstaForex, se le proporciona una gran cantidad de servicios gratuitos para una operación eficiente.


