 Permanecer
Condiciones de negociación
Products
Herramientas


Good day!
In this article, we will analyze in detail the technical picture for the USD/JPY currency pair, and also try to determine the positioning for this instrument. Let's start with the weekly chart.
Weekly
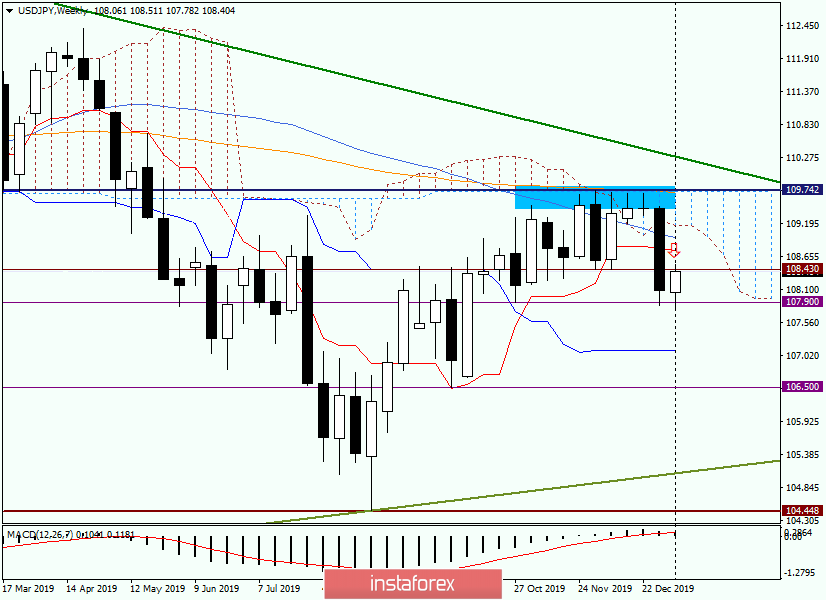
After a fairly long consolidation and trading in the sideways range, last week it was released down. However, it depends on what parameters to set the range, I mean its lower border. Personally, for me, this mark is 108.43, and you can count on 108.25 and 107.90. By the way, the last level has limited the decline, and the pair is trying to recover from it.
Although this is not just recovery, it is an intention to return above the broken support level and the lower limit of the range, the mark of 108.43. It is time to remind that 108.50 is a very strong technical and historical level, which has repeatedly influenced the price movements of USD/JPY. So at the time of writing, trading is conducted near the mark of 108.42.
If you allow the passage above 108.50, it can reach the area of 108.75-108.97, where the Tenkan line of the Ichimoku indicator and 50 is a simple moving average. Technically, sales look good from here, and if you take into account the lower limit of the weekly cloud, the sales zone can be expanded from 108.75 to 109.15.
Since the growth is already happening and is perceived as a rollback to the broken levels and price zones, purchases, in my opinion, are already overdue, they should have been opened earlier.
Daily
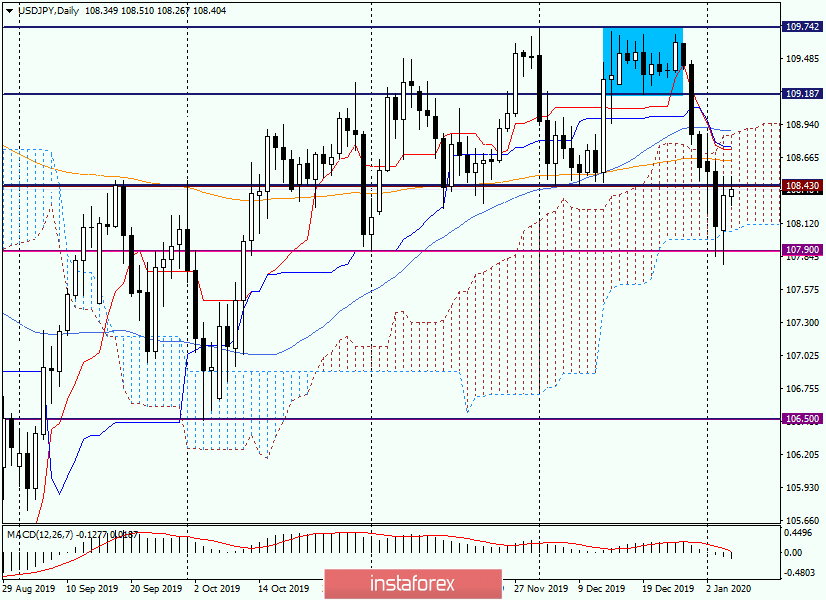
In this timeframe, there is clearly a struggle to get down from the Ichimoku cloud. Bears are trying their best to squeeze the price out of the cloud down, and the bulls are trying to prevent this. As a result of this confrontation, we see quite long lower shadows of candles for January 3 and 6. At the moment, the bulls are winning, the pair is trading around the middle of the Ichimoku cloud. All the more interesting to look at what will happen next. I assume that the rebound from under the lower border of the cloud can be continued to the levels of 108.64, 108.75, and 108.90, where respectively 144 EMA, Tenkan, Kijun, the upper border of the cloud and 50 MA. All of the above can provide strong resistance and turn the quote down, so near all of these levels should be considered opening short positions. Here I recommend paying attention to the level of 108.75, which has already appeared in the description of the weekly timeframe.
H4
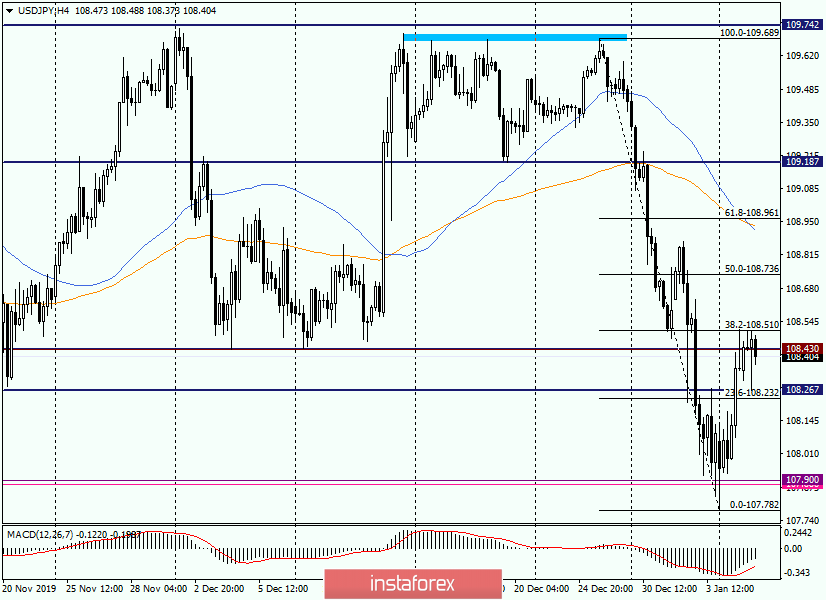
Oil painting. Not otherwise. Having stretched the Fibonacci grid to a decrease of 109.69-107.78, we see that the pair corrected exactly to the second retracement level from this movement - 38.2. Here, near 108.50, the quote met with strong resistance, which, for me personally, is not at all surprising. Rather naturally.
Quite strong support is observed at 108.27. I believe that the exit from the corridor of 108.51-108.27 will determine the short-term prospects of USD/JPY. I believe that the exit will take place up and the pair will reach the price area of 108.75-108.95, where I recommend considering opening deals for sale. Again, the mark of 108.75. When the same level plays a significant role in several timeframes, it only emphasizes its strength and importance, as well as the right point for opening positions. In our case, short ones.
Good luck!
¡Los informes analíticos de InstaForex lo mantendrá bien informado de las tendencias del mercado! Al ser un cliente de InstaForex, se le proporciona una gran cantidad de servicios gratuitos para una operación eficiente.

