 Permanecer
Condiciones de negociación
Products
Herramientas


The pair moved up on Friday and reached the resistance line 1.3119, presented in a red dotted line. After that, the price quickly went down. Strong calendar news is not expected today. Perhaps there is a continuation of work down to the support line 1.2983 presented in a red bold line.
Trend analysis (Fig. 1).
As the price moves down today, it can test the support line 1.2983, presented in a red bold line. Only after that can it start moving up to the target of 1.3080, the pullback level of 38.2% presented in a red dashed line. If this line is reached, the market can continue to work up with the target and the upper fractal 1.3119.
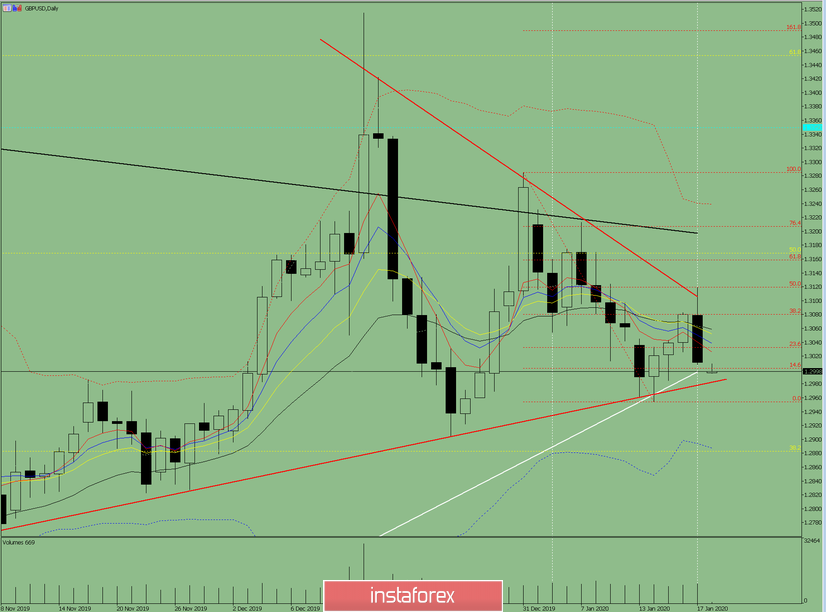
Fig. 1 (daily chart).
Comprehensive analysis:
- Indicator analysis - up;
- Fibonacci levels - up;
- Volumes - up;
- Candlestick analysis - up;
- Trend analysis - up;
- Bollinger Lines - up;
- Weekly schedule - up.
General conclusion:
Today, the price may start to move up.
A downward scenario is unlikely but quite possible. That is, from the resistance line 1.2983, presented in a red bold line, continue to work down with the target 1.2954, the lower fractal in a red dashed line.
¡Los informes analíticos de InstaForex lo mantendrá bien informado de las tendencias del mercado! Al ser un cliente de InstaForex, se le proporciona una gran cantidad de servicios gratuitos para una operación eficiente.


