 Permanecer
Condiciones de negociación
Products
Herramientas


USD/JPY
The dollar lost 30 points against the yen on Tuesday following the fall of the stock market (S&P 500) by 0.27%. The reason was a certain Chinese virus that caused the death of several people. We are very far from the perception of the local outbreak of the flu for the global epidemic, but, as it has been more than once in the last decade, pharmaceutical companies may well make a fuss and pull down markets using another cause of the disease. Today, the Chinese China A50 is down 1.21% in the Asian session, while the Japanese Nikkei225 is up 0.31%. The stability of the Japanese market helps the yen stay in the range of Fibonacci levels of 100.0-110.0% on the daily chart.
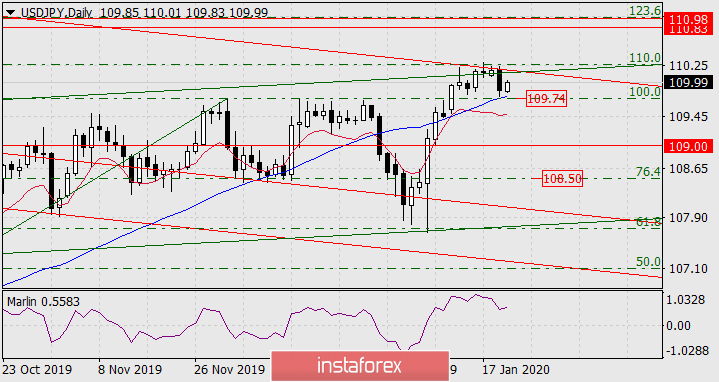
Consolidating the price under yesterday's low formally opens 108.50 at the Fibonacci level of 76.4%, but there are many obstacles to it from earlier record levels, 109.00 looks the most powerful - July 10 last year high and May 13 low. Overcoming the price peak on January 17 (110.30) may delay or stop the panic and send the price to the range of 110.83/98.
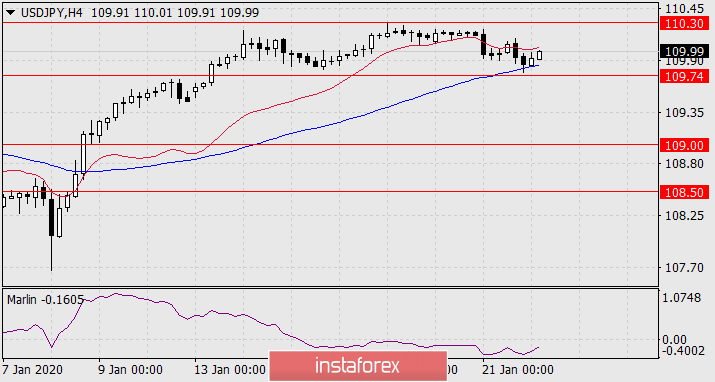
On a four-hour chart, the price is above the MACD line. Consolidating under it, which will automatically mean also consolidating below the MACD line of a higher scale, will unfold a complex, multivariant scenario of pulling down.
¡Los informes analíticos de InstaForex lo mantendrá bien informado de las tendencias del mercado! Al ser un cliente de InstaForex, se le proporciona una gran cantidad de servicios gratuitos para una operación eficiente.

