 Permanecer
Condiciones de negociación
Products
Herramientas


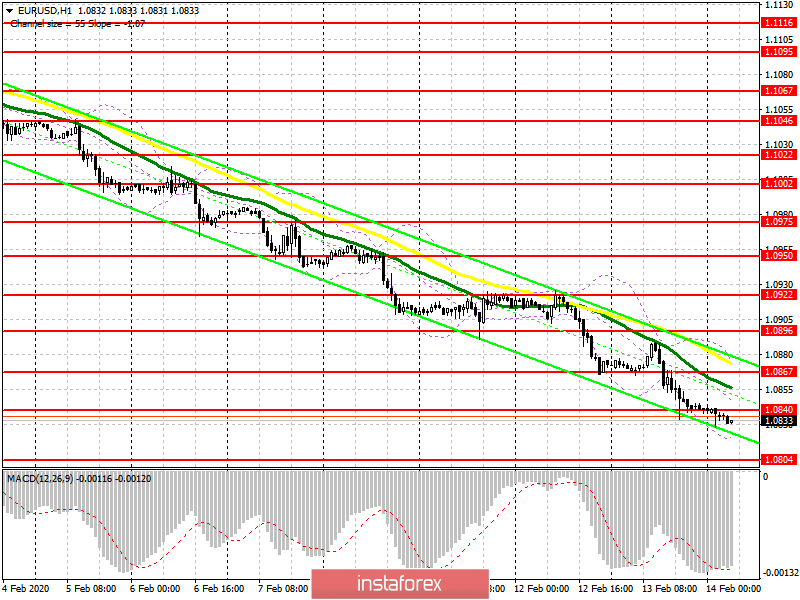
To open long positions on EURUSD you need:
Another unsuccessful attempt to grow amid the report of the European Commission, which revised the forecast for inflation in the eurozone upward, which caused the euro to fall, and a breakout of the level of 1.0867 pulling down the pair to the area of 1.0840, under which trade is now being conducted. There is no one willing to buy the euro, as evidenced by the constant breakdown of emerging divergences. I have not seen this for quite some time. Therefore, you need to be careful, and only returning to 1.0840 with good reports on GDP in Germany and the eurozone will allow the bulls to return to the market and reach the resistance of 1.0867, a breakthrough of which will lead the pair to a high of 1.0896, where I recommend taking profit. In case the euro falls further to long positions, you can look at the rebound from a low of 1.0804, or even deeper, in the support area of 1.0773.
To open short positions on EURUSD you need:
Sellers formed a false breakout in the resistance area of 1.0892 and achieved a breakout of 1.0867, which led to the next sale of the euro according to the trend, since after breaking through the lows of last year, judging by the schedule, there are no more buyers in the market. The increase in short positions in the European currency and the sharp gap between those who want to buy and sell in a non-profit net position also confirms the prevalence of bears in the market. It can be seen from the COT report that long non-profit positions decreased from 180,653 to 166,925, while short non-profit positions, on the contrary, increased to 242,005 from 239,515. I recall that long nonprofit positions represent the total long open position of nonprofit traders, and short non-profit positions represent the total short open position of non-profit traders. The gap and difference between these positions (net position) indicates market sentiment and trend direction. Euro sellers only need to maintain the level of 1.0840 and the formation of a false breakout on it, which will lead to further sale of EUR/USD to the low of 1.0804 and 1.0773, where I recommend taking profits. In case bulls return to the level of 1.0840 in the morning after good statistics, it is best to return to short positions for corrections from a high of 1.0867, or sell the euro immediately for a rebound near 1.0896.
Signals of indicators:
Moving averages
Trading is conducted below 30 and 50 moving average, which indicates a continuation of the bearish trend.
Bollinger bands
A break of the lower boundary of the indicator at 1.0820 will lead to selling the euro. Growth will be limited by the upper level of the indicator in the area of 1.0870.
Description of indicators
¡Los informes analíticos de InstaForex lo mantendrá bien informado de las tendencias del mercado! Al ser un cliente de InstaForex, se le proporciona una gran cantidad de servicios gratuitos para una operación eficiente.


