 Permanecer
Condiciones de negociación
Products
Herramientas


Hello, dear colleagues!
In today's article, we will summarize the interim results of trading on February 10-14 and consider the options for closing the current week. Intermediate because the week is not closed yet and various changes may occur during the day.
Such a strong bearish sentiment remains on the main currency pair that it is hardly necessary to count on a radical change in the situation. However, as I have repeatedly noted, the most incredible things happen in the market, and you should always be prepared for this. As they say, keep an eye out.
First, let's take a look at the economic calendar, which may be interesting and significant for the main currency pair. Despite the last day of the trading week, there are plenty of events.
Eurozone: German GDP, eurozone GDP, trade balance, no seasonal adjustments.
USA: import price index, retail sales, industrial production, consumer sentiment index from the University of Michigan.
You can see the time and forecasts for these and other events in the economic calendar.
Weekly
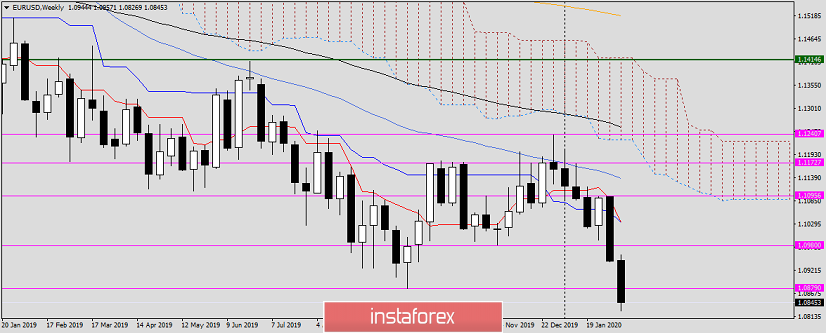
As I have written many times, I usually show and review the weekly chart on Mondays, after the close of the previous trading week. Today, I decided to pay attention to the weekly timeframe to show the full strength of the bear market for EUR/USD.
The pair is under pressure and is trading below the most important support level of 1.0879. However, there is a slight rebound from the current minimum values, which were shown at 1.0827.
If the weekly trading closes below the pink support level of 1.0879, it is likely to be considered broken and expect a continuation of the downward trend.
If market sentiment suddenly changes in favor of the single European currency and the current weekly candle is with a long lower shadow and the closing price above 1.0879, it is time to think about a reversal. At least, about the reversal on the correction. So far, these are the main points that you should pay attention to on the weekly chart.
Daily
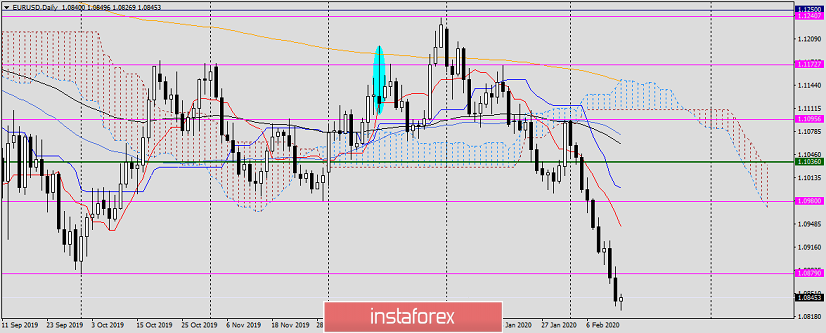
The candle for February 11, which could become a reversal, did not become one. Bears simply "ate" it, as evidenced by the two subsequent days of intensive decline.
Is history repeating itself today? Once again, a nondescript candle with a small bull body. After the previous false reversal candle, it is difficult to believe in a reversal for correction.
However, various kinds of emotions should be put aside and set out a trading plan for yourself.
Although today is Friday, when it is better not to open new deals and not to transfer them to Monday, in case of a rollback to the support area of 1.0879, I suggest selling EUR/USD. A higher and more favorable price for opening short positions on this pair is at 1.0945, where the Tenkan line of the Ichimoku indicator has fallen (following the price). But to be honest, today there is very little chance that the price will reach such high values. It's good if they reach 1.0879. That is all that comes to mind when looking at the daily chart.
H1
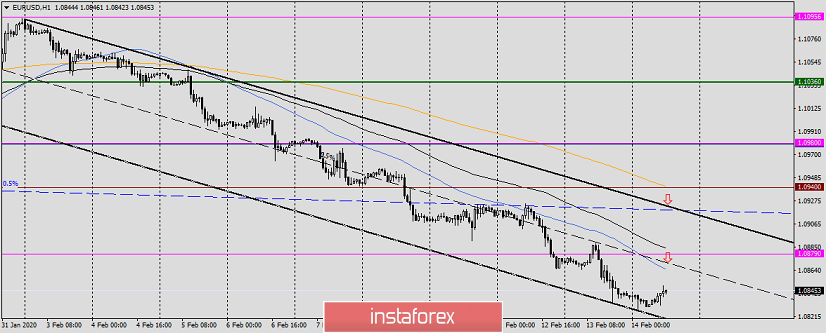
I built a descending channel with the parameters of 1.1093-1.1049 (resistance line) and 1.0834 (support line).
Arrows indicate the proposed options for sales. And tellingly, they coincide with the assumptions for opening short positions given above.
As you can see, near the broken support of 1.0879, there is a middle line of the channel (dashed), 50 simple and 89 exponential moving averages. All this can become a very strong resistance if the price rises to the area of 1.0879. Sales from here are technically justified.
Further prices for opening short positions can be found on the approach to the upper border of the channel — this is the area of 1.0920. Typically, the hourly 200 EMA is at 1.0940, slightly below 1.0945, where the daily line of the Ichimoku Tenkan indicator runs.
I think it's clear. I will not load you with unnecessary writing anymore. In my personal opinion, sales are technically justified near 1.0879 and around 1.0915-1.0945.
Good luck!
¡Los informes analíticos de InstaForex lo mantendrá bien informado de las tendencias del mercado! Al ser un cliente de InstaForex, se le proporciona una gran cantidad de servicios gratuitos para una operación eficiente.

