 Permanecer
Condiciones de negociación
Products
Herramientas


USD/JPY
The quote of the USD/JPY currency pair crossed the upper limit of the range of two lines of the price channel of 107.00-107.83 yesterday . This opens the immediate growth target of 108.75 - the resistance of the MACD line on the daily chart.
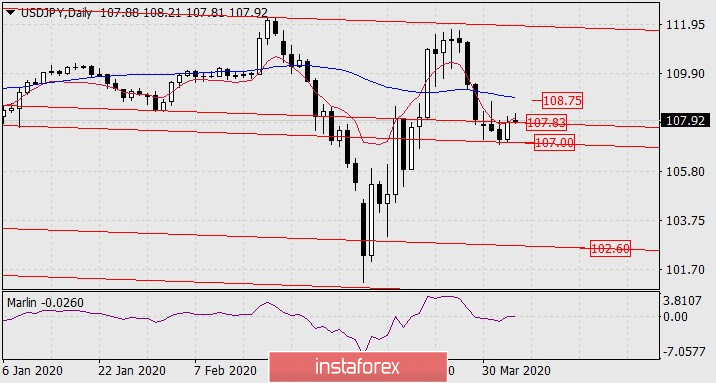
The signal line of the Marlin oscillator is on the zero line (actually a little higher, but in the current context it does not matter), the price is still held by the resistance of the balance indicator line. And now, after the price left the uncertain range of 107.00-107.83, the price entered another uncertain range of 107.83-108.75. In general, as long as the price is in the 107.00-108.75 range, uncertainty will remain and directly from a practical point of view, the non-trading situation may persist for several more days. The price exit under the lower limit of the range (107.00) opens the prospect of a decline to 102.60. The price exit above 108.75 still does not open the prospect of growth, since there are resistance on the lower-level chart.
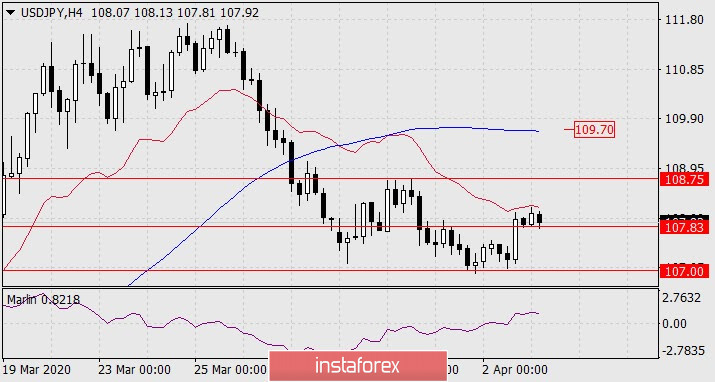
This resistance is the MACD line at 109.70 on the four-hour chart. At the moment, the price is under the red indicator line of the balance, the Marlin oscillator is in the growth zone, which only confirms uncertainty in the indicated price ranges.
¡Los informes analíticos de InstaForex lo mantendrá bien informado de las tendencias del mercado! Al ser un cliente de InstaForex, se le proporciona una gran cantidad de servicios gratuitos para una operación eficiente.

