 Permanecer
Condiciones de negociación
Products
Herramientas


The pair traded upward on Friday after breaking through the support line 1.0790 (presented in a blue bold line). It then tested the 21 average EMA 1.0854 (presented in a black thin line) and then traded downwards. Today, the price may continue to move up. Nothing is expected from the economic calendar news.
Trend analysis (Fig. 1).
Today, an upward trend is possible from the level of 1.0822 (closing of the Friday afternoon candle) with the target of 1.0864 - a 38.2% retracement level (presented in a blue dashed line). It is very likely that from this level, the price may continue to move upward with the target of 1.0894 - a 50.0% pullback level (presented in a blue dashed line).
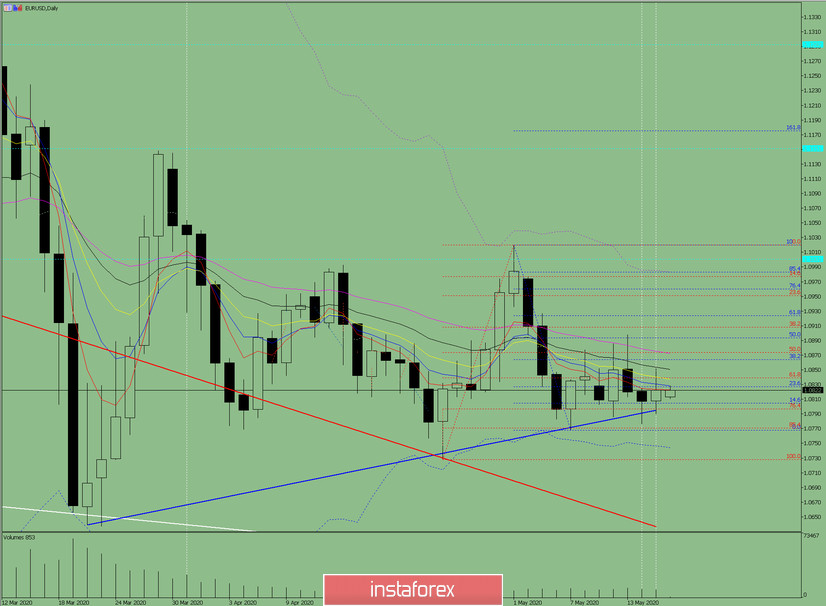
Fig. 1 (daily chart).
Comprehensive analysis:
- Indicator analysis - up;
- Fibonacci levels - up;
- Volumes - up;
- Candlestick analysis - neutral;
- Trend analysis - up;
- Bollinger Lines - down;
- Weekly schedule - up.
General conclusion:
Today, the price may continue to move upward with the target of 1.0864 - a 38.2% pullback level (presented in a blue dashed line).
Another possible scenario is a downward trend from the level of 1.0822 (closing of the Friday afternoon candle) with the target at the support line 1.0794 (presented in a blue bold line).
¡Los informes analíticos de InstaForex lo mantendrá bien informado de las tendencias del mercado! Al ser un cliente de InstaForex, se le proporciona una gran cantidad de servicios gratuitos para una operación eficiente.


