 Permanecer
Condiciones de negociación
Products
Herramientas


Trend analysis.
This week, the price from the level of 1.1099 (closing of the last weekly candle) may continue to move up with the first target 1.1174 - the historical resistance level (blue dashed line). After reaching this level, the price will continue to increase to the next upper target 1.1213 - a pullback level of 76.4% (blue dashed line).
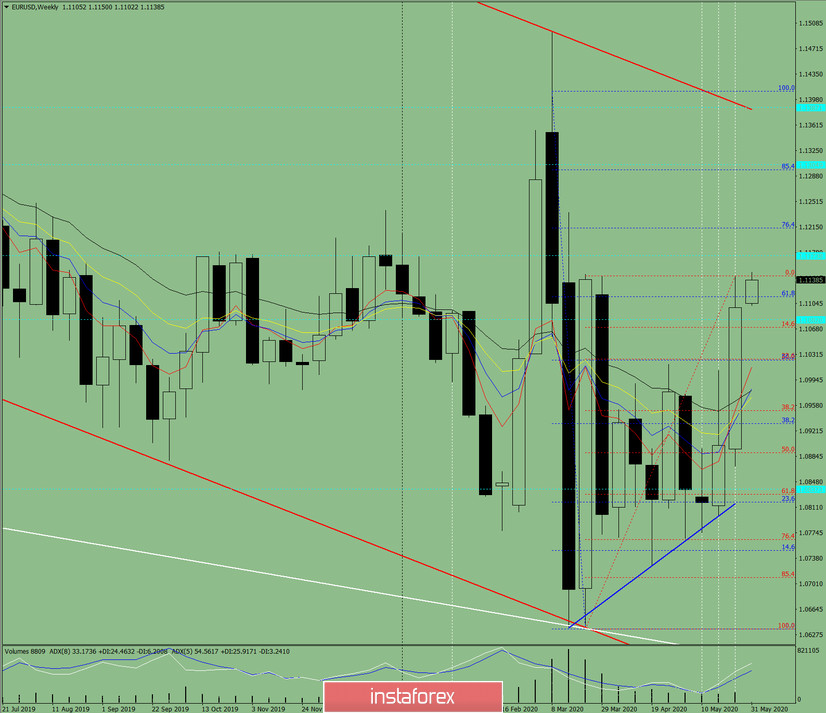
Fig. 1 (weekly schedule).
Comprehensive analysis:
- indicator analysis - up;
- Fibonacci levels - up;
- volumes - up;
- candlestick analysis - up;
- trend analysis - up;
- Bollinger Lines - down;
- monthly chart - up.
The conclusion of a comprehensive analysis is an upward movement.
The total result of calculating the candlestick of the EUR/USD currency pair according to the weekly chart: the price of the week is likely to have an upward trend, with the absence of a lower shadow for the weekly white candlestick (Monday - up) and the absence of a second upper shadow (Friday - up).
The upper weekly target 1.1213 is a pullback level of 76.4% (blue dashed line).
An unlikely lower scenario: the price from the upper fractal - 1.1145 (red dashed line) can start moving down, with the first target 1.1024 - a pullback level of 23.6% (red dashed line).
¡Los informes analíticos de InstaForex lo mantendrá bien informado de las tendencias del mercado! Al ser un cliente de InstaForex, se le proporciona una gran cantidad de servicios gratuitos para una operación eficiente.

